“Twenty years from now you will be more disappointed by the things that you didn't do than by the ones you did do. So, Explore. Dream. Discover.” - H. Jackson Brown Jr.
Throughout my life both academically and professionally, I have been constantly developing my interest in data analytics. From a Software Developer to Data Analyst, my dream to explore further in Technology and Business led me to pursue a Masters in Management Information Systems, which exposed me to Data analytics, Business Intelligence, and Strategy Consulting.
I always believe in constant learning, wherein my exploration steered my passion for Data Science where we “Explore. Hypothesize. Discover” with Data, to pursue an additional Master’s Degree in Business Analytics, where I received in-depth exposure to Machine Learning Algorithms & various Data Analytics tools like SQL, R, Python, Tableau, SAS, etc.
So far, as a Data Analyst at Infosys Limited, Data Analytics and BI Developer at UIC as well as a Pricing Analytics Intern at Zoro, I was able to prove that data-driven decision-making is always the key to any business.
Looking forward to Explore. Dream. Discover…
Currently, I am in the job market looking for opportunities in data analytics, business intelligence and data science.
Kindly contact me to know more about how I can contribute and add value to your organization.
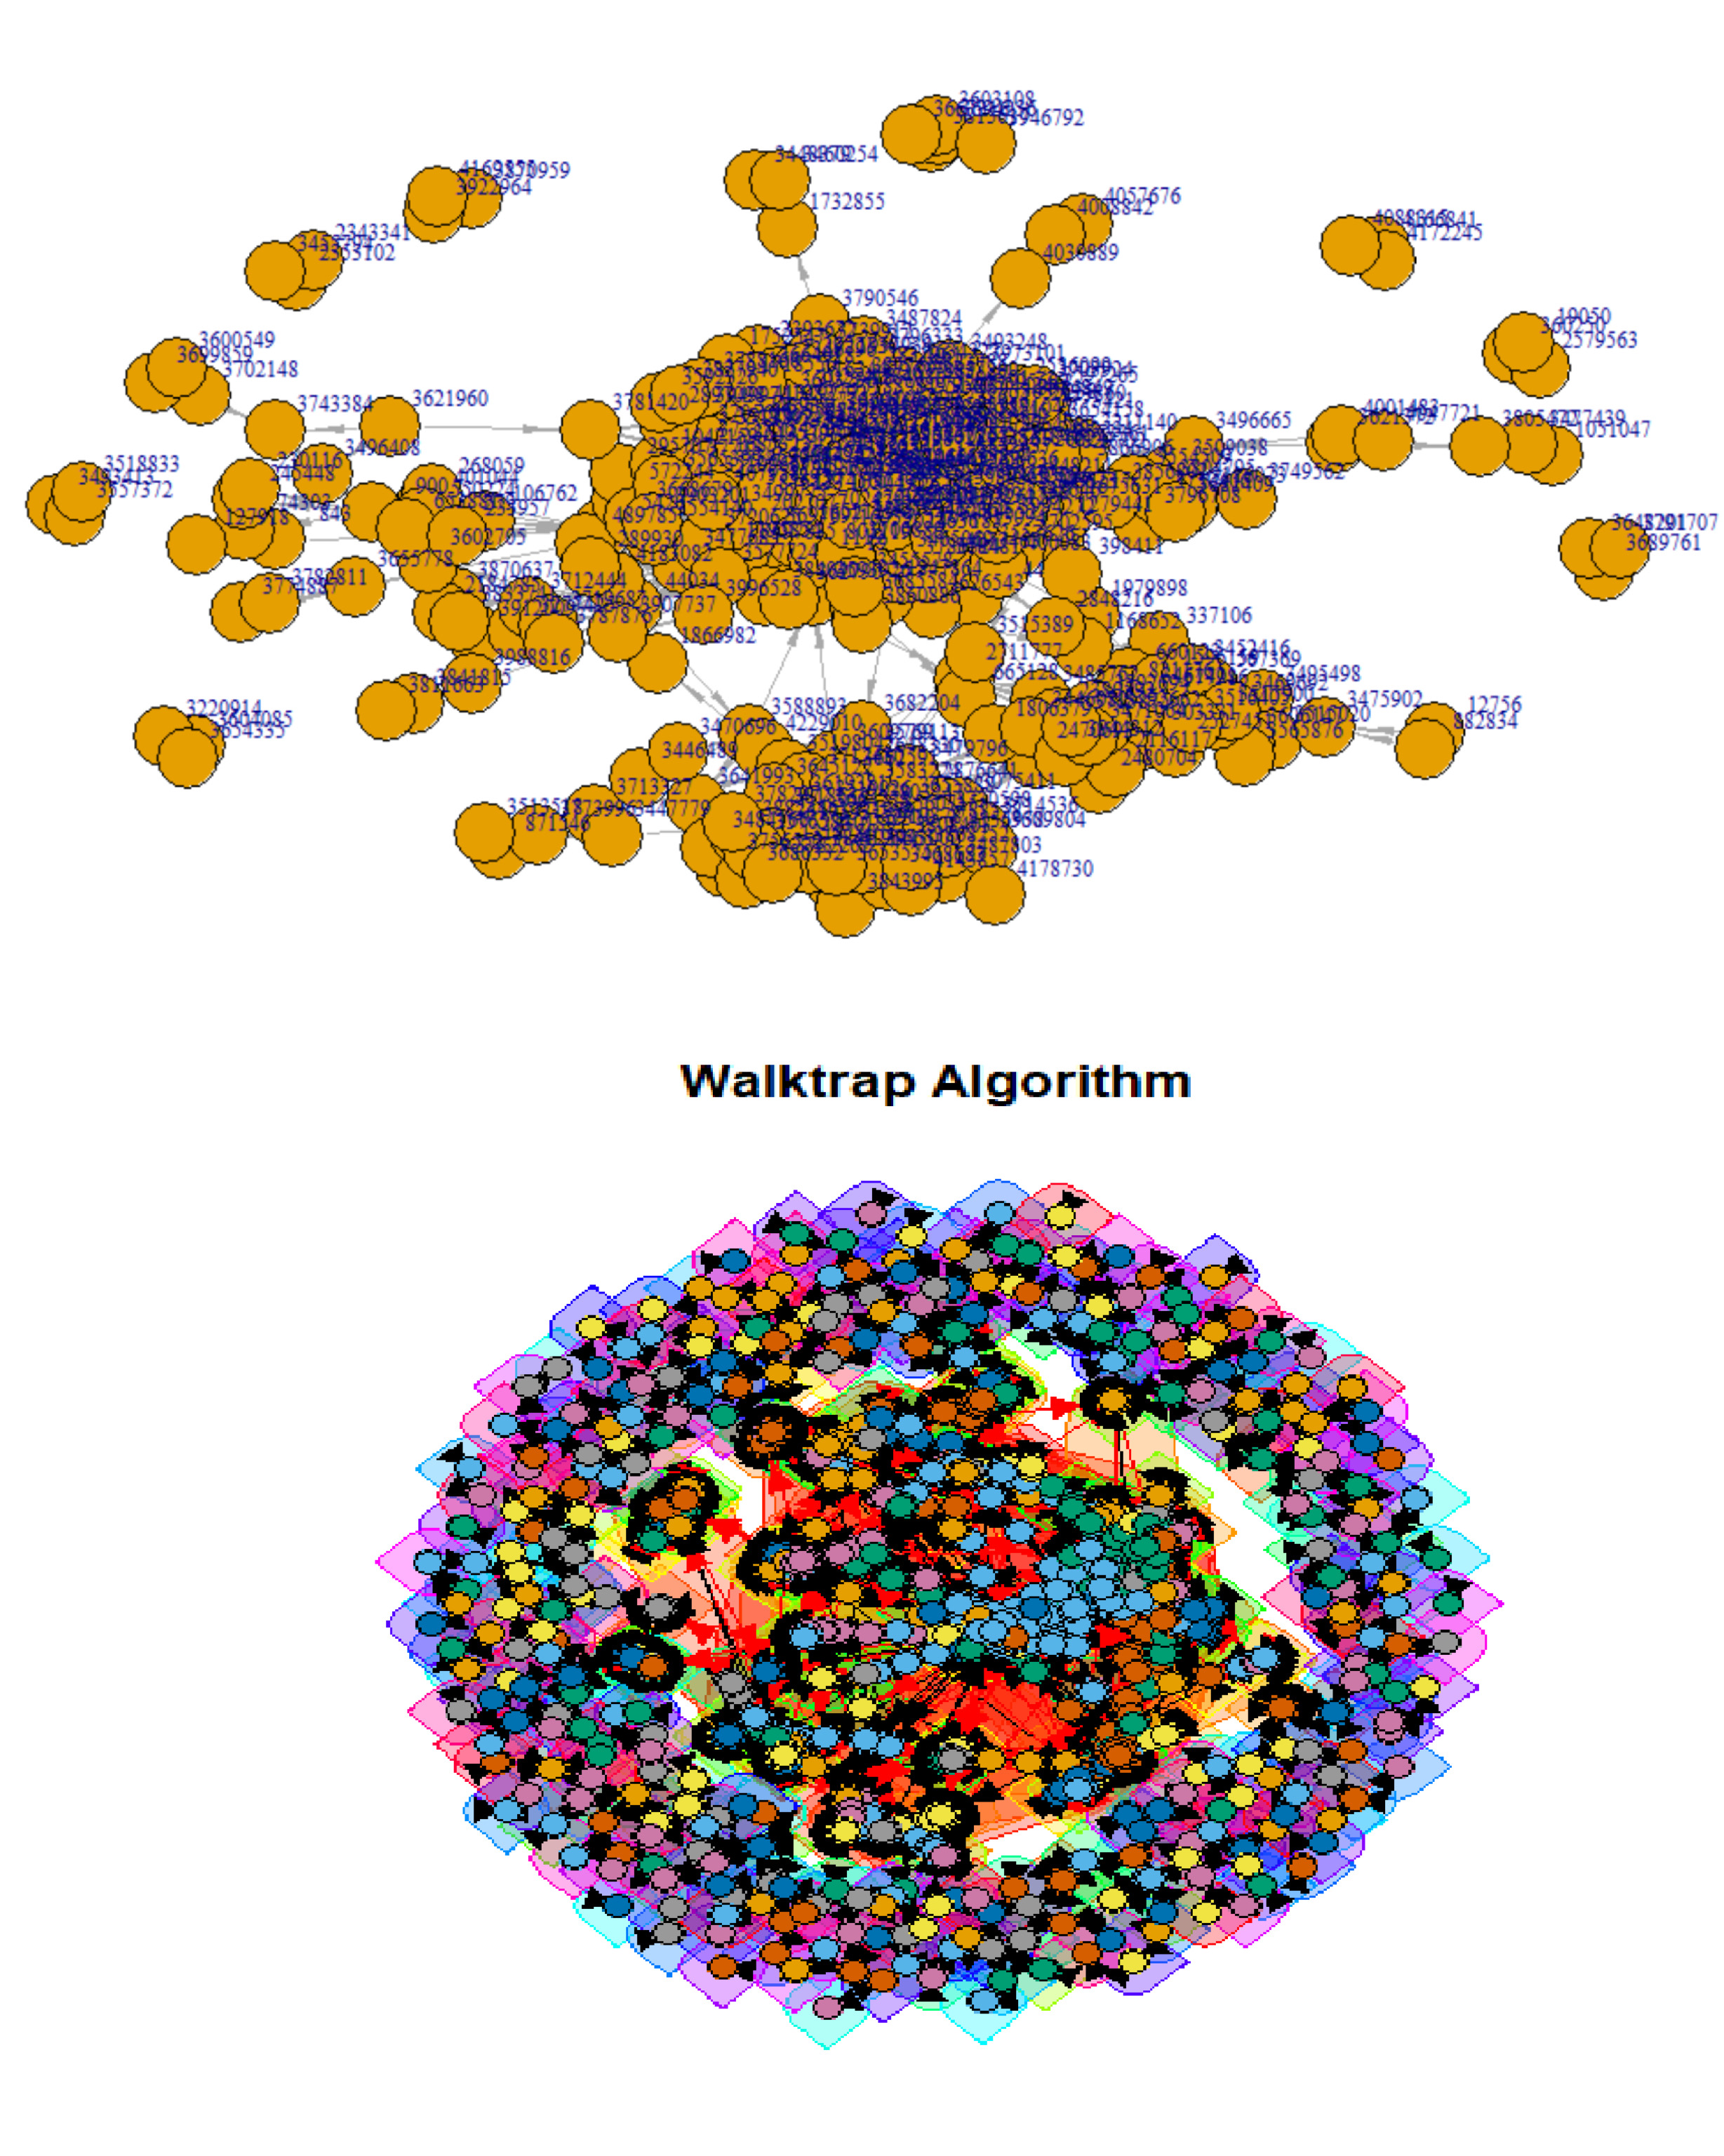
Analyzed Github undirected network data of 37.7K nodes & 289K edges to find the characteristics, the collaboration between ML and Web Developers, find most popular developers in both networks.
Identified several sub-communities & also provided insights on how to improve collaboration.
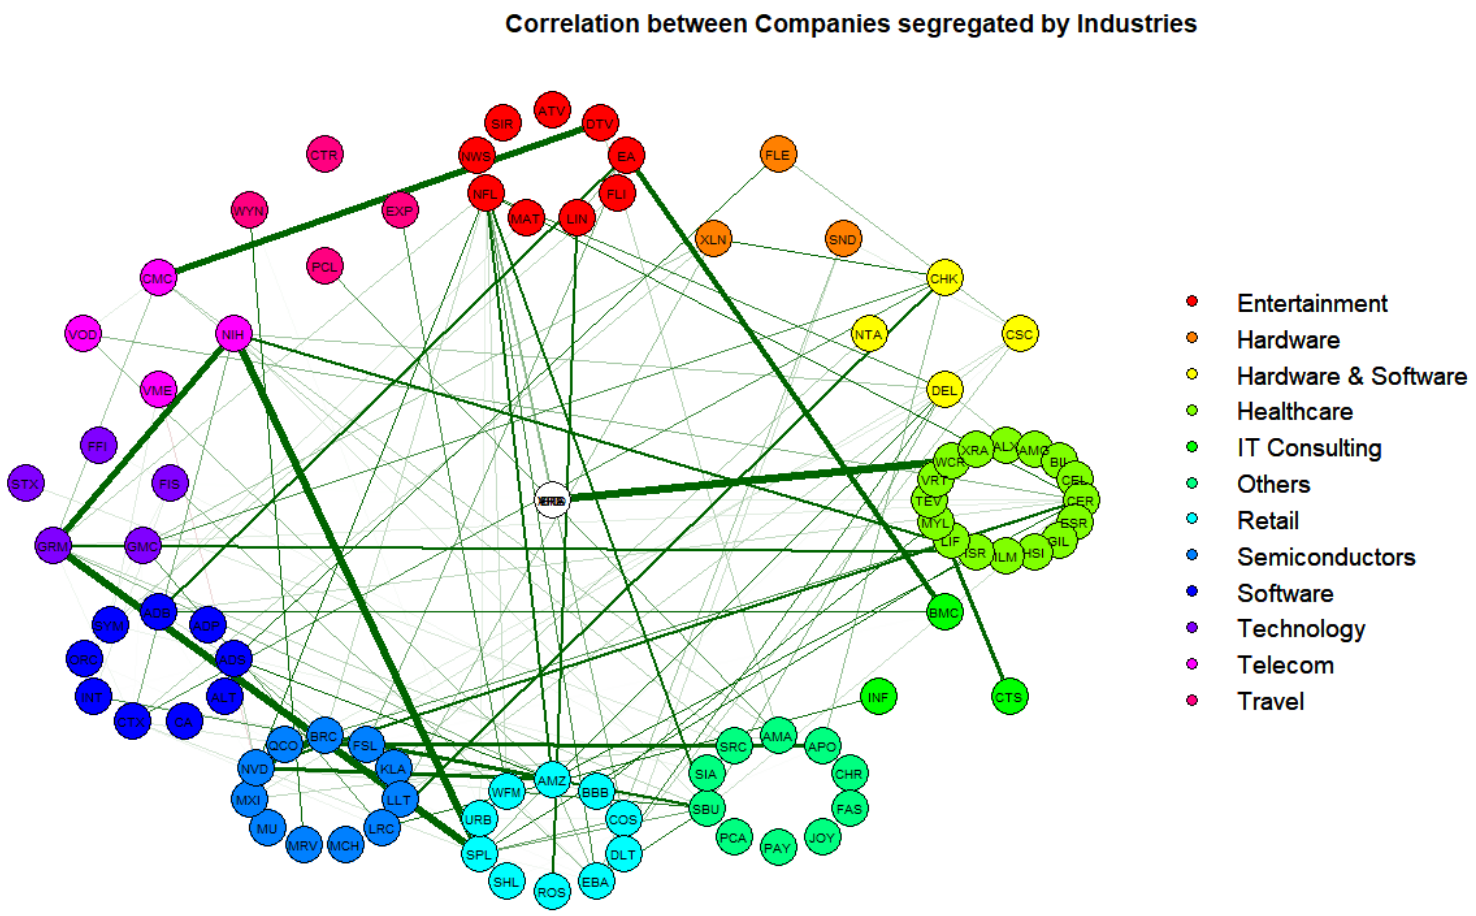
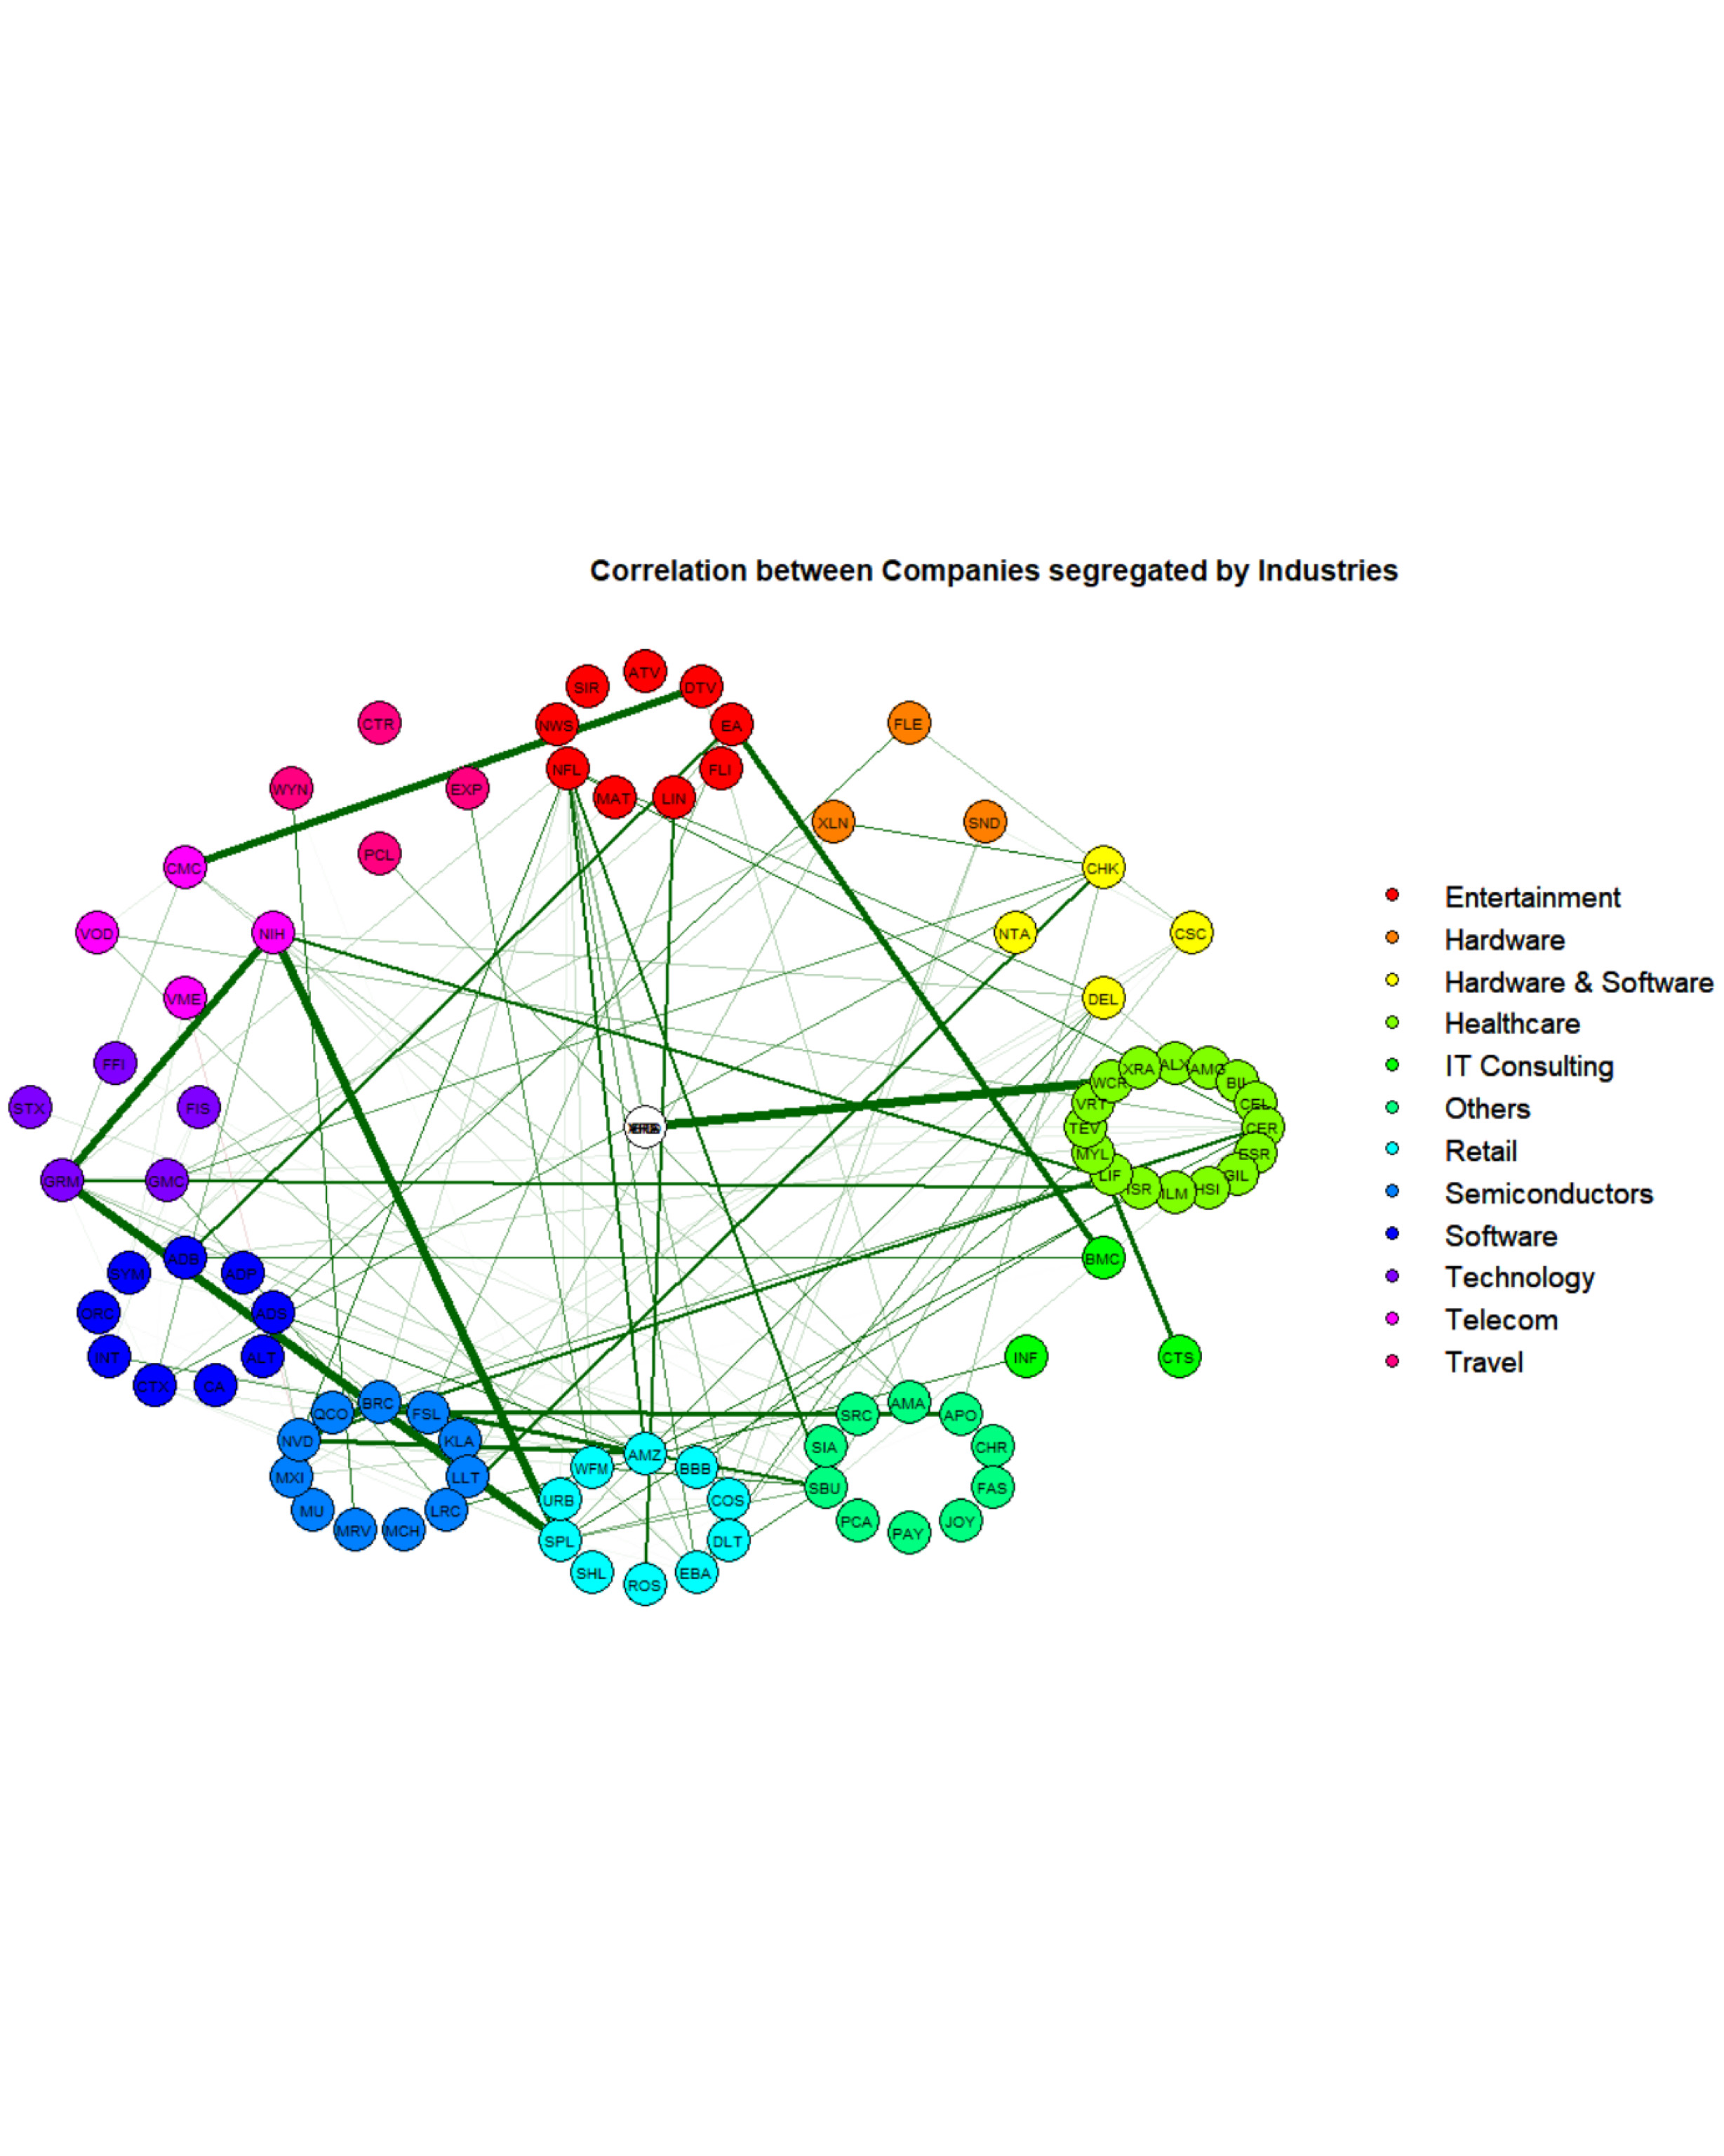
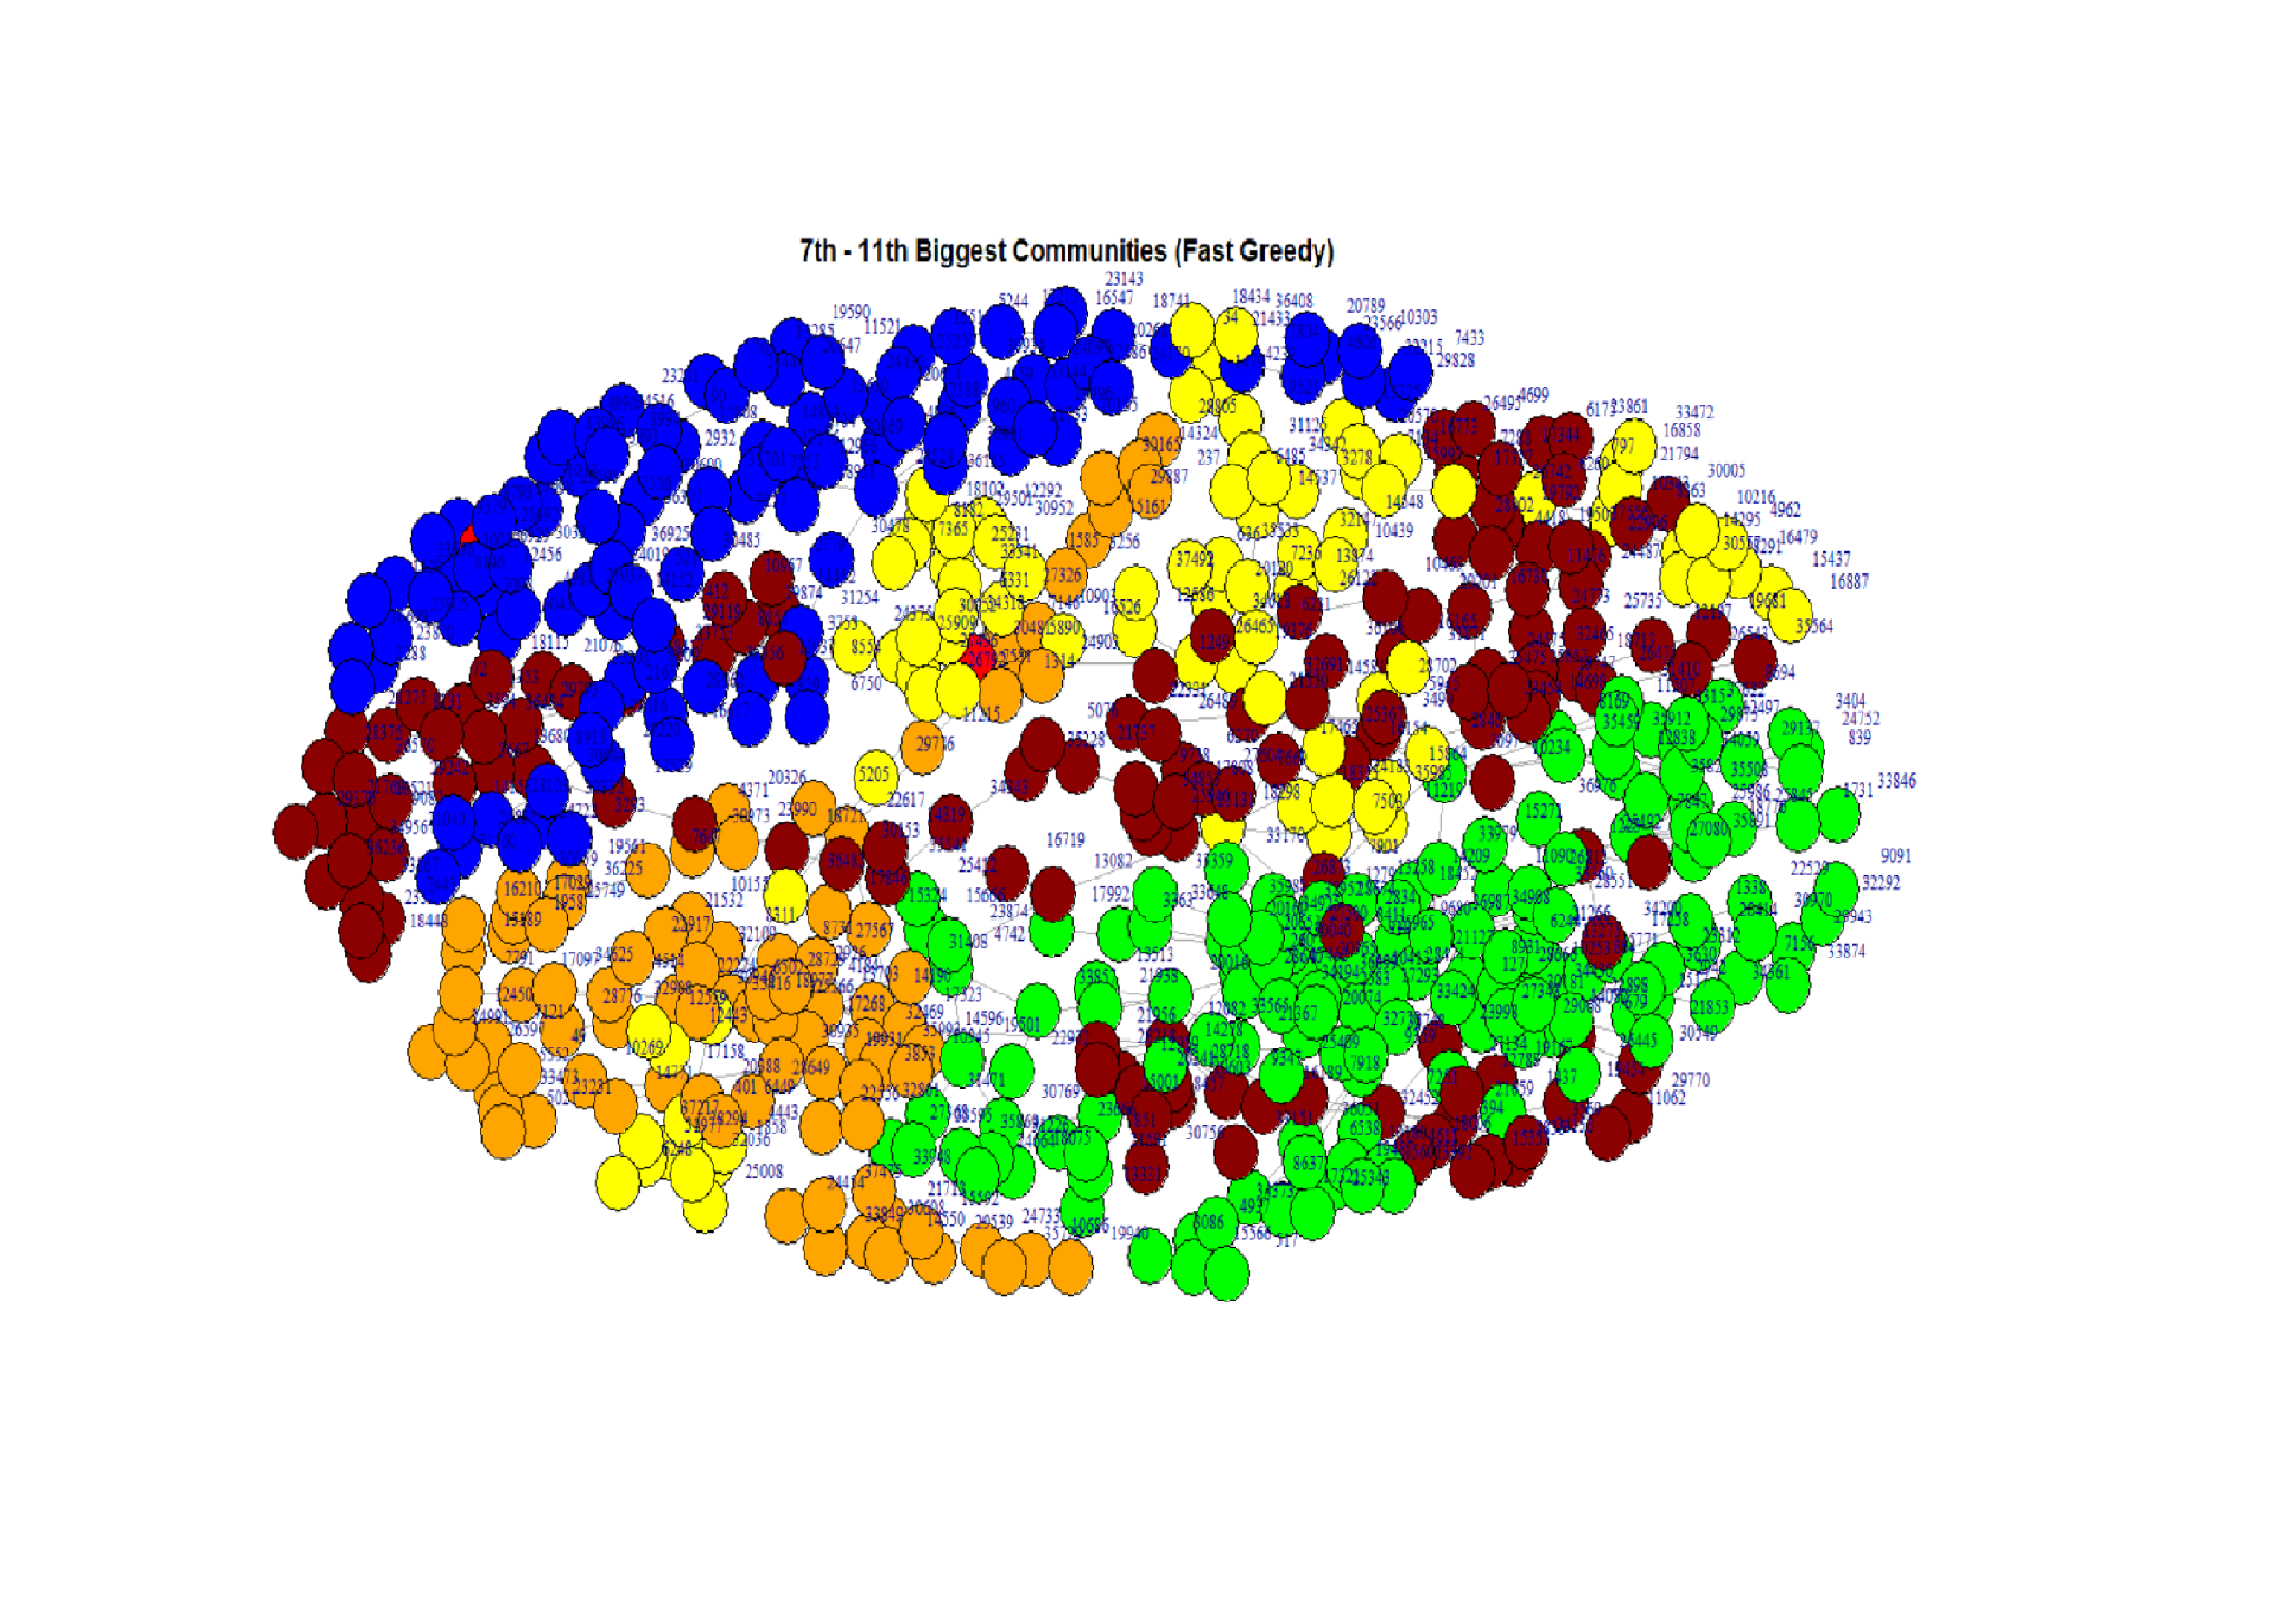
Some firms may have closely related patterns in the amount of social media chatter about them over time. In this project, I have built and described the undirected networks that link firms based upon the (partial) correlations in their Twitter activity.
I have analyzed what the resulting network reveals about the relationship between the firms as they are described on Twitter. I have also explained whether the edges appear to represent competitive relationships, cooperative relationships, or some other type of connection.
Some of the methods/techniques which I used in this project include: partial correlation, Fisher’s transformation, Benjamini-Hochberg adjustment and finaly creating visualizations of these links between the networks.
This project analyzes the implications of the Network Structure of the SAP Online Knowledge Community Platform. It has a complex network structure with 6090 Edges & 3415 Vertices.
The project includes analysis and findings of the features of the network, its overall structure, the distributions of network measures among nodes and edges, and all their implications of the SAP knowledge community.
The findings also include trust, reciprocity, authority, and access to information, strong triadic closure is present in this network, and what the data tells us about the role of local bridges and weak ties.
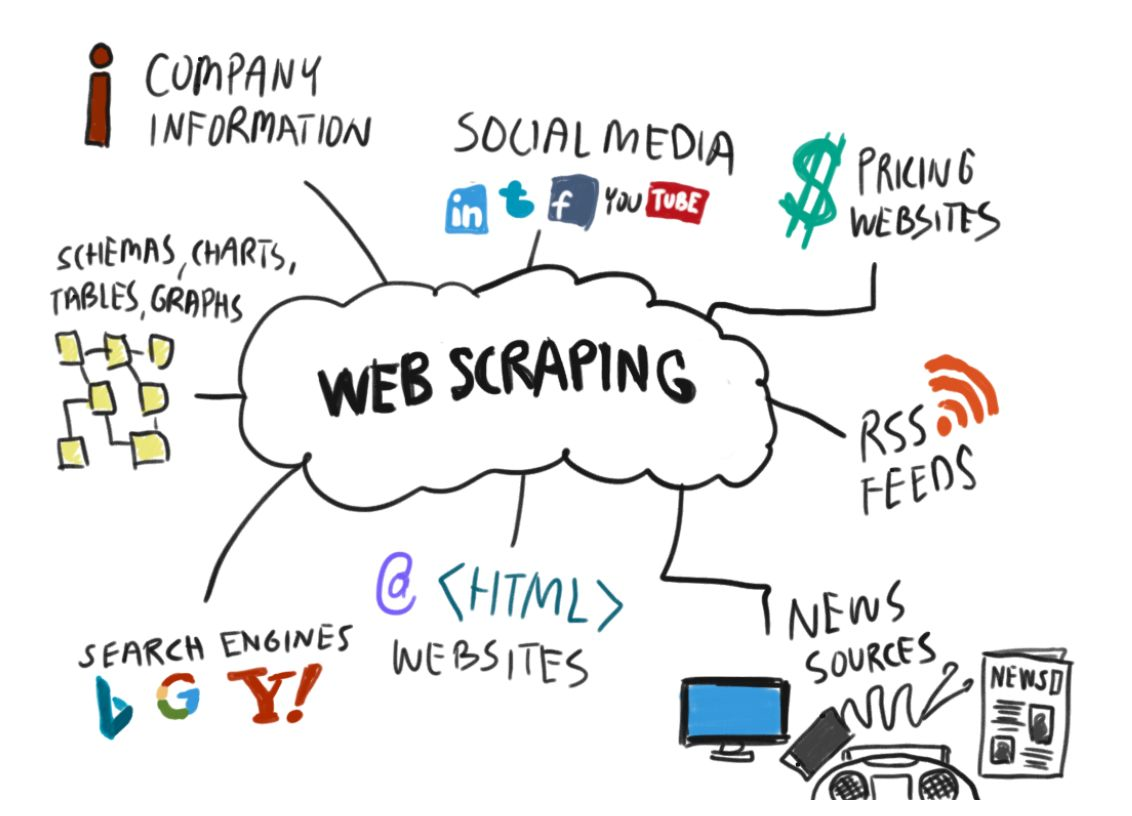
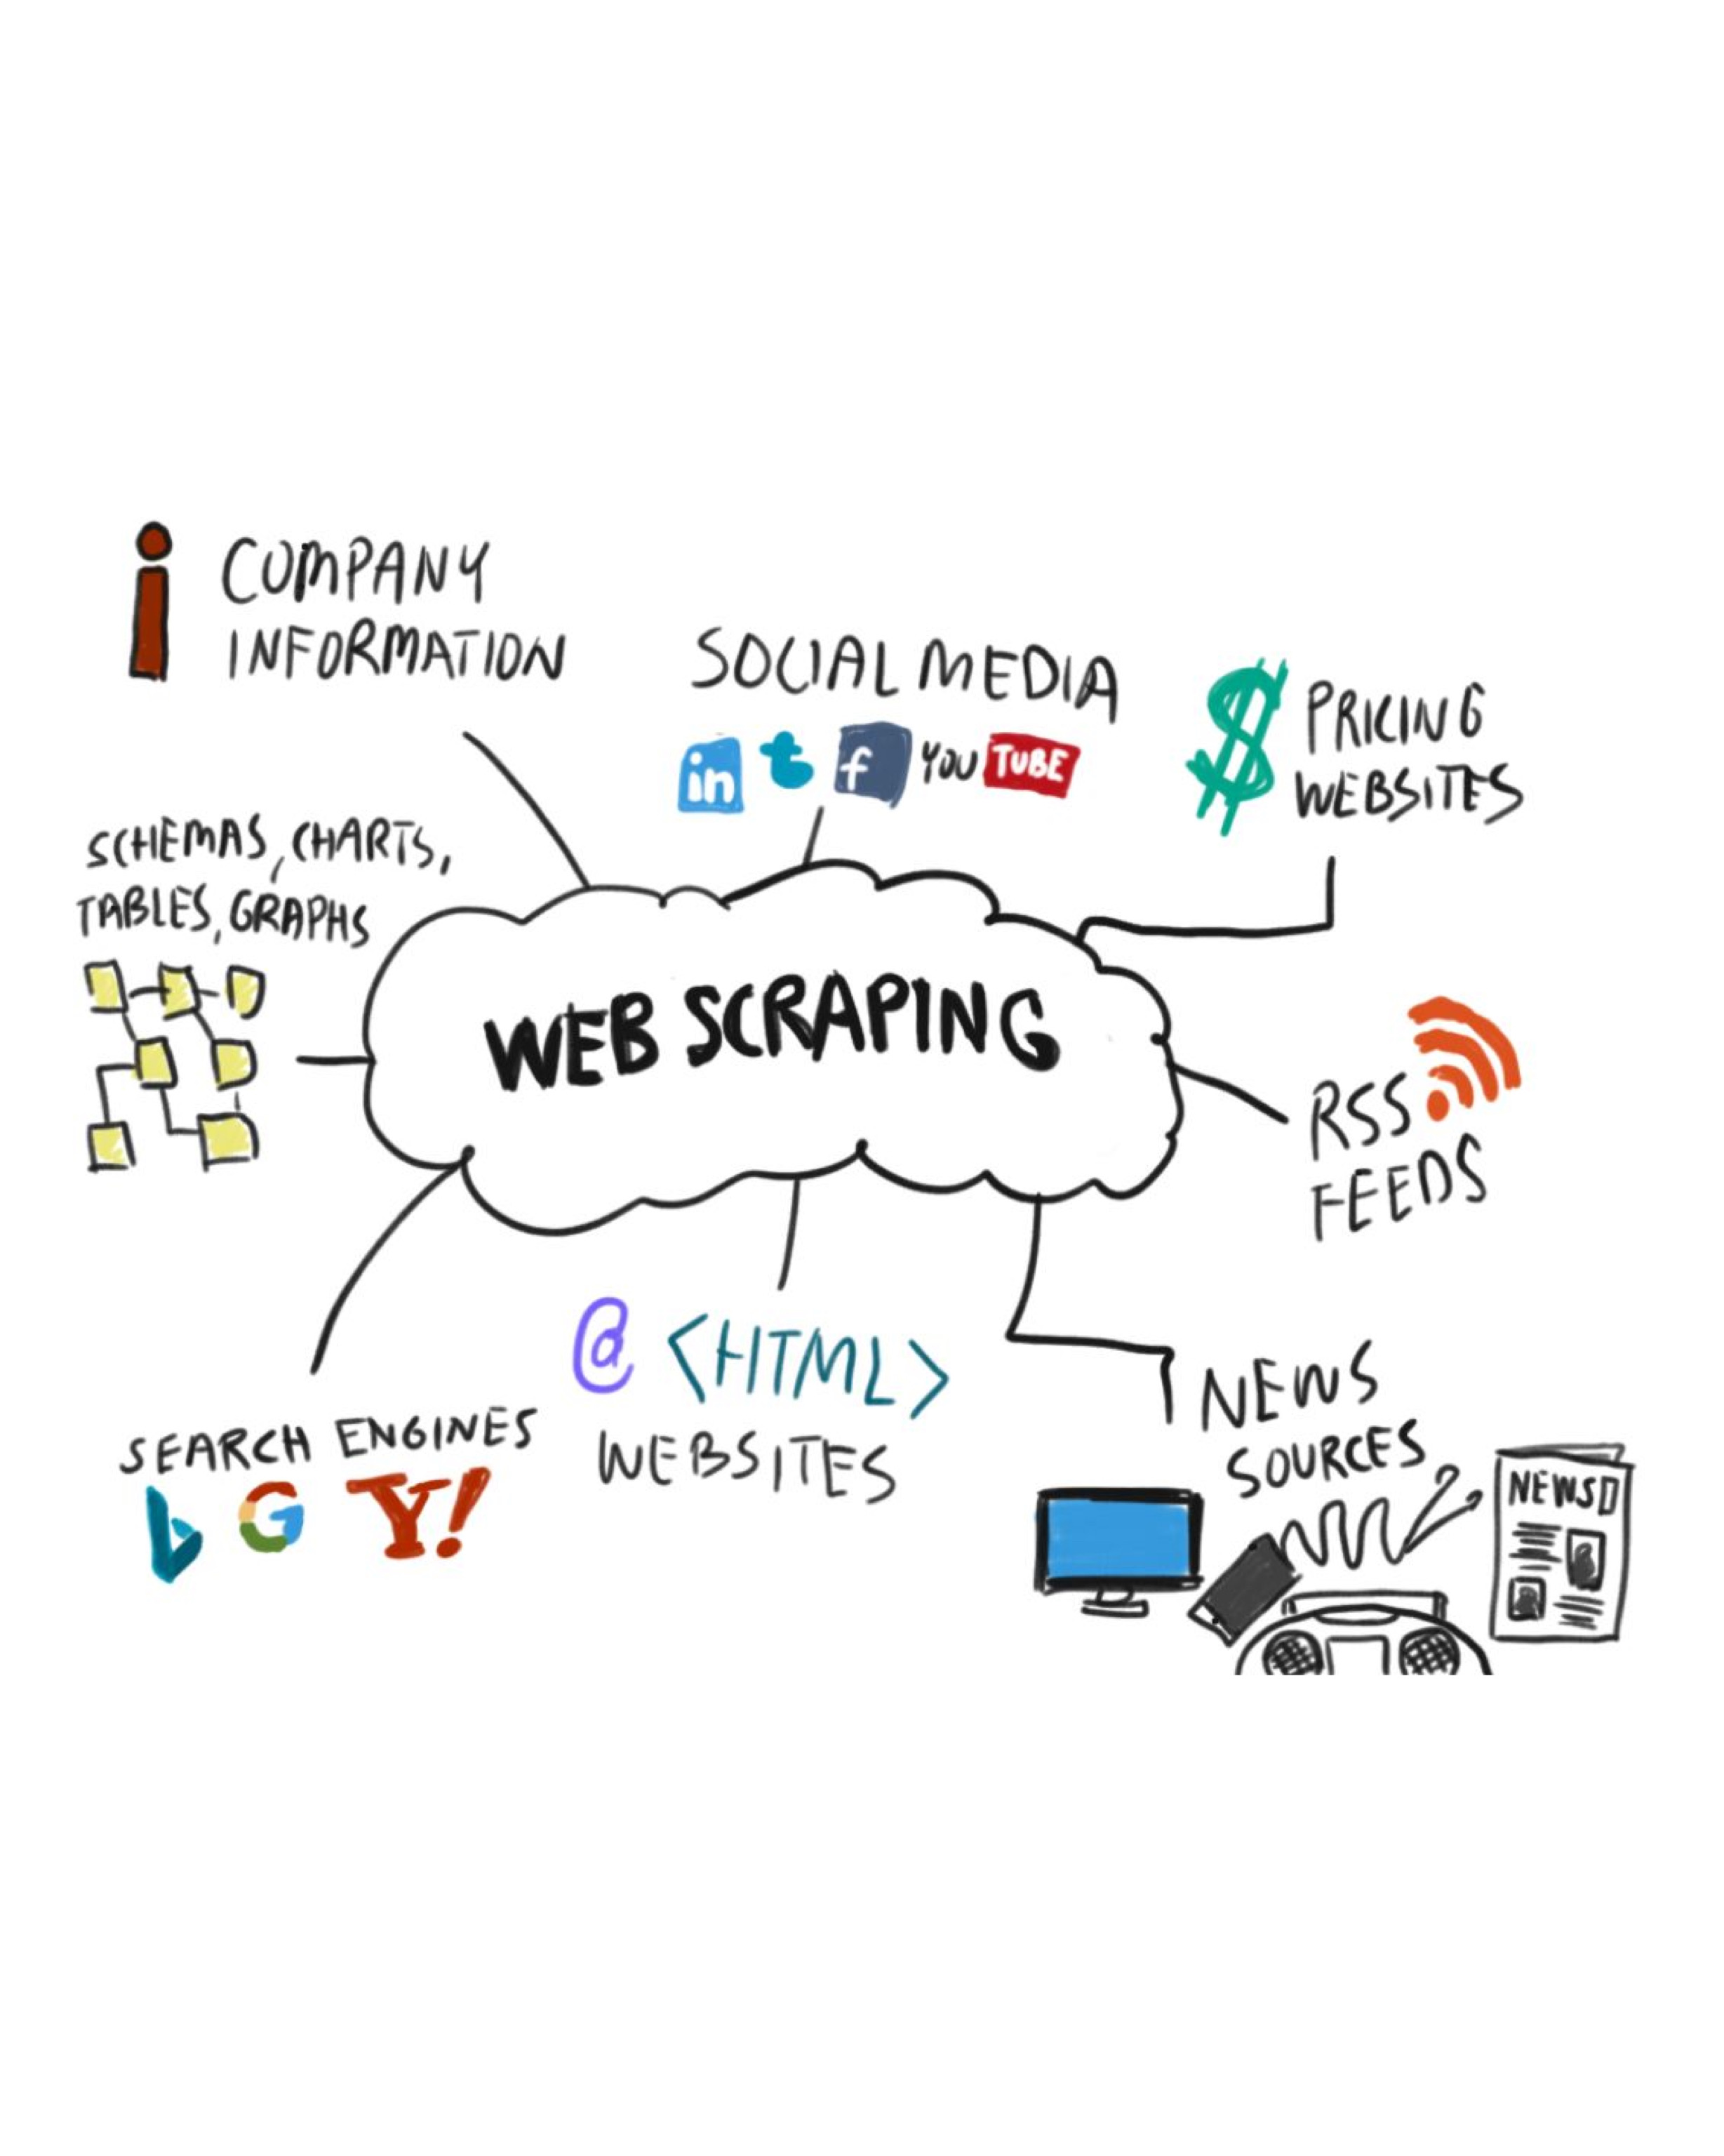
Web scraped 2500+ Physicians and their reviews (50,000 records) from ratemd website using beautifulsoup4
Preprocessed the data & implemented text mining and NLP techniques and built a Recommender System for the patients

Analyzed the characteristics of the users/nonusers of online system to access EMR health records using the HINTS 5 Cycle 2 dataset containing 449 Features and 3504 samples.
Identified 20 important features which were key indicators of EMR online user activity. Developed models and visualizations to determine the similar characteristics of the portal users across 5 different categories.
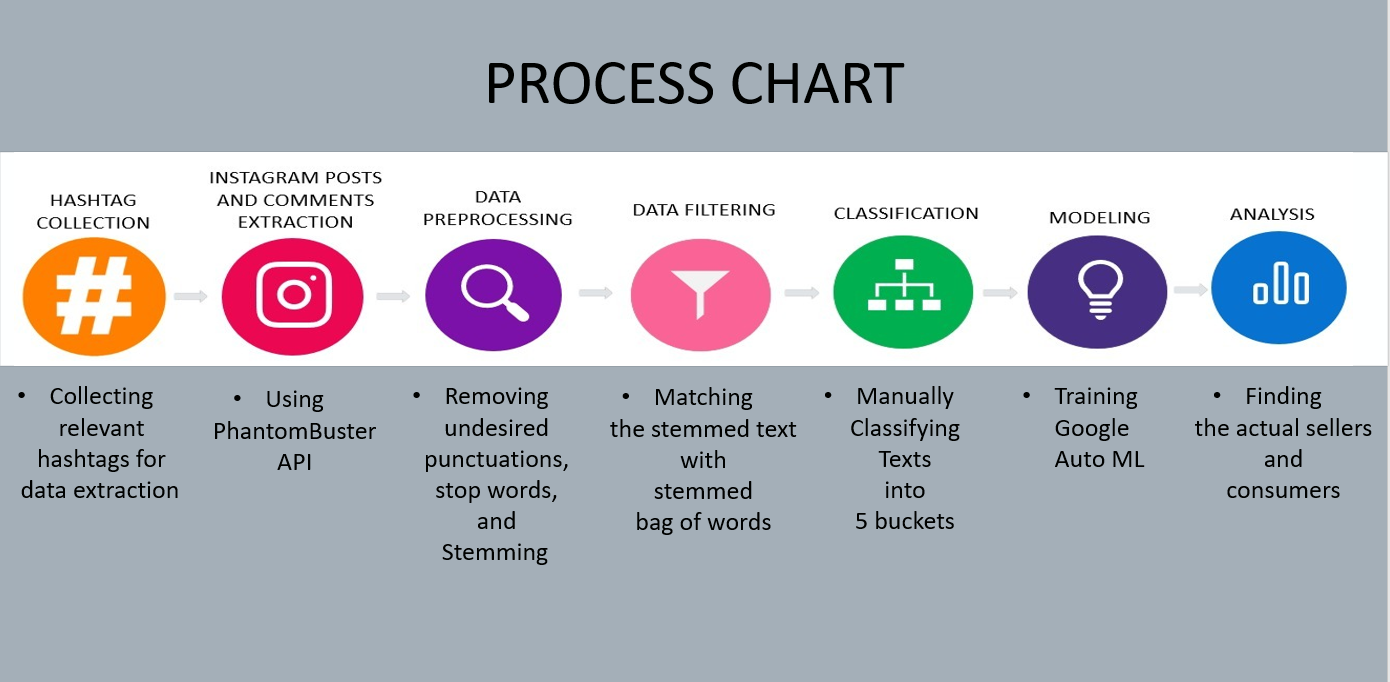
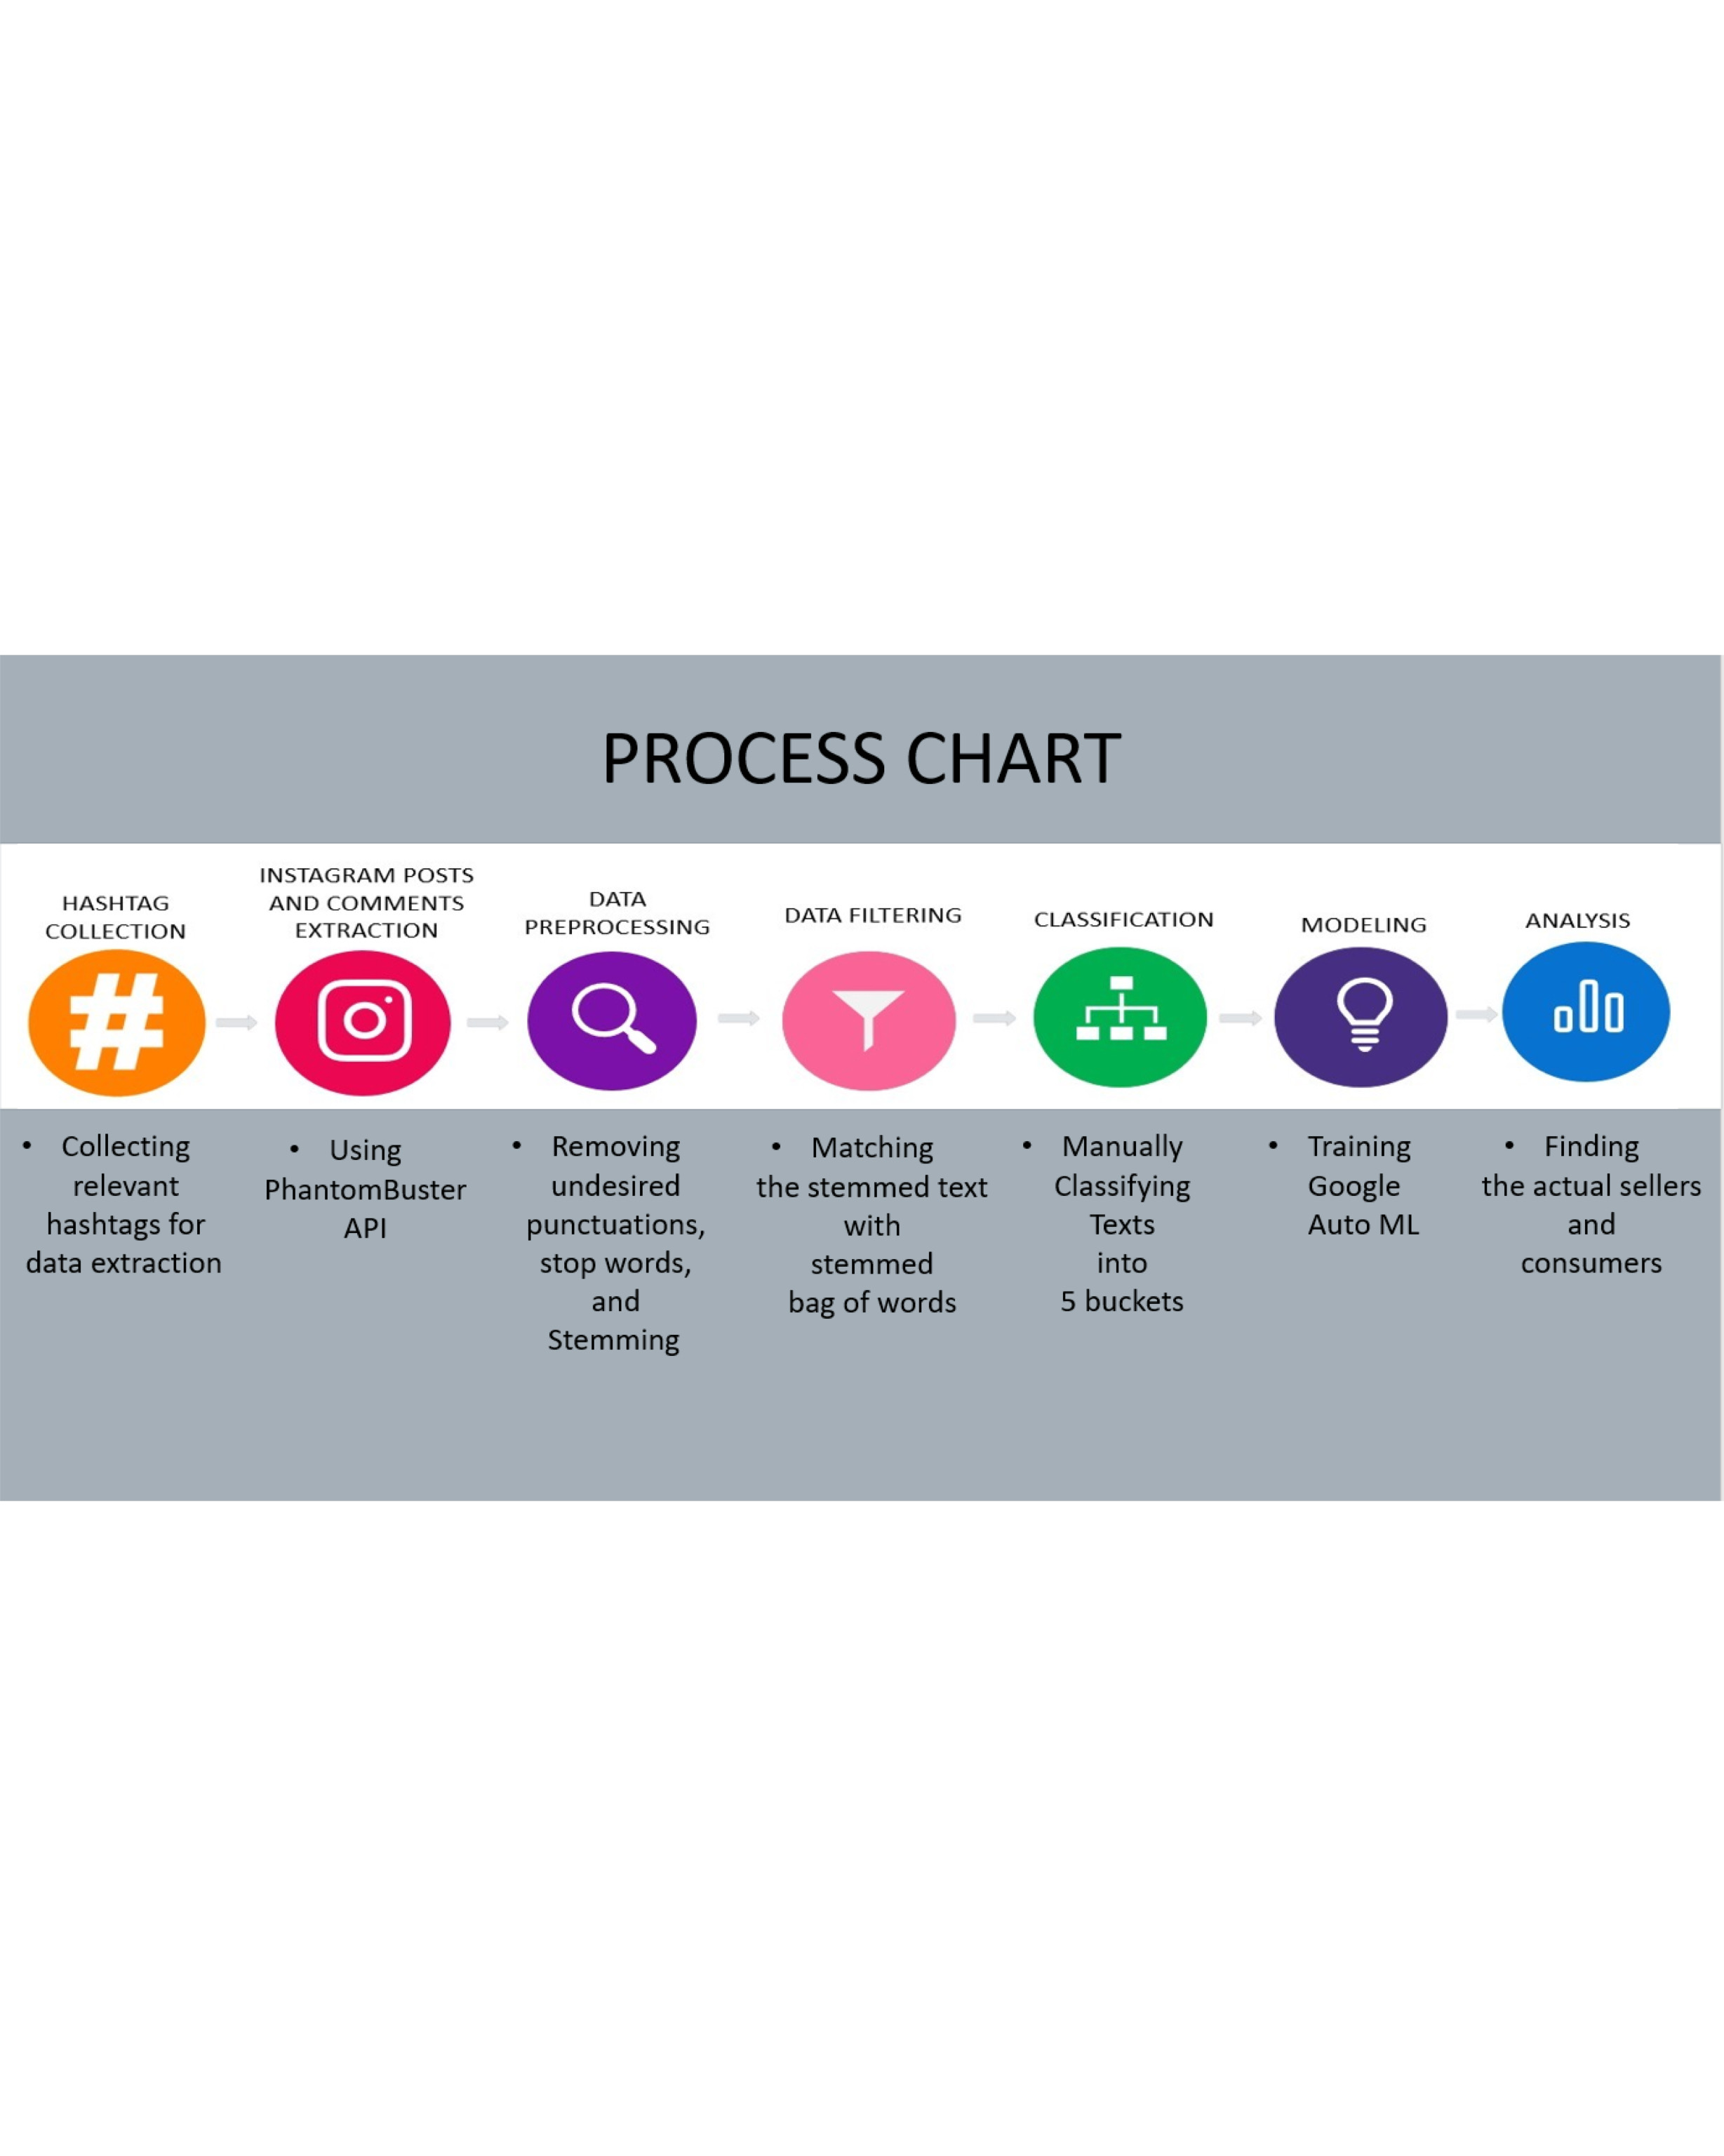
Developed a solution to detect and classify Illicit Online Marketing, Sales & consumption of Controlled Substances via Instagram: Using NLP & Machine Learning models. Identified 10 illegal individual & online sellers.

Implemented bag of words model and sentiment mining using SVM classification of three allergy medication drug tweets collected for a period of one month from April 1 to April 28 - 2018.
Identified the effectiveness of the drugs, their 9 undisclosed Adverse Drug Reactions from 48 negative tweets, and their frequent common side effects and presented the findings to our client – a leading US pharmaceutical company.
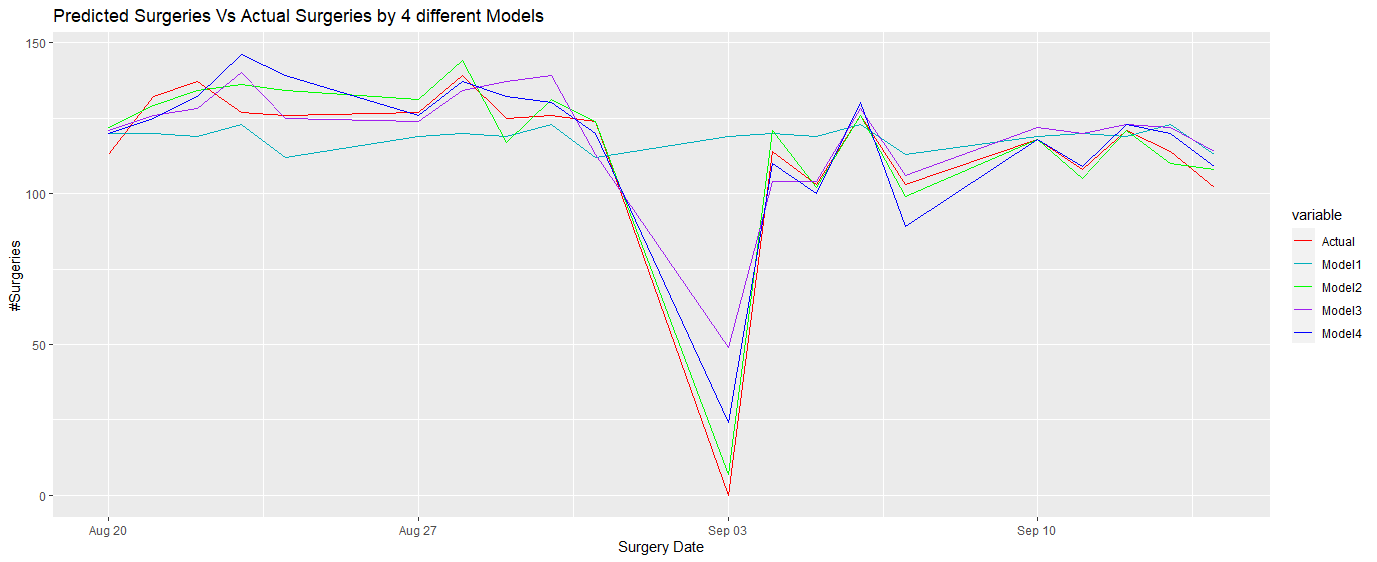
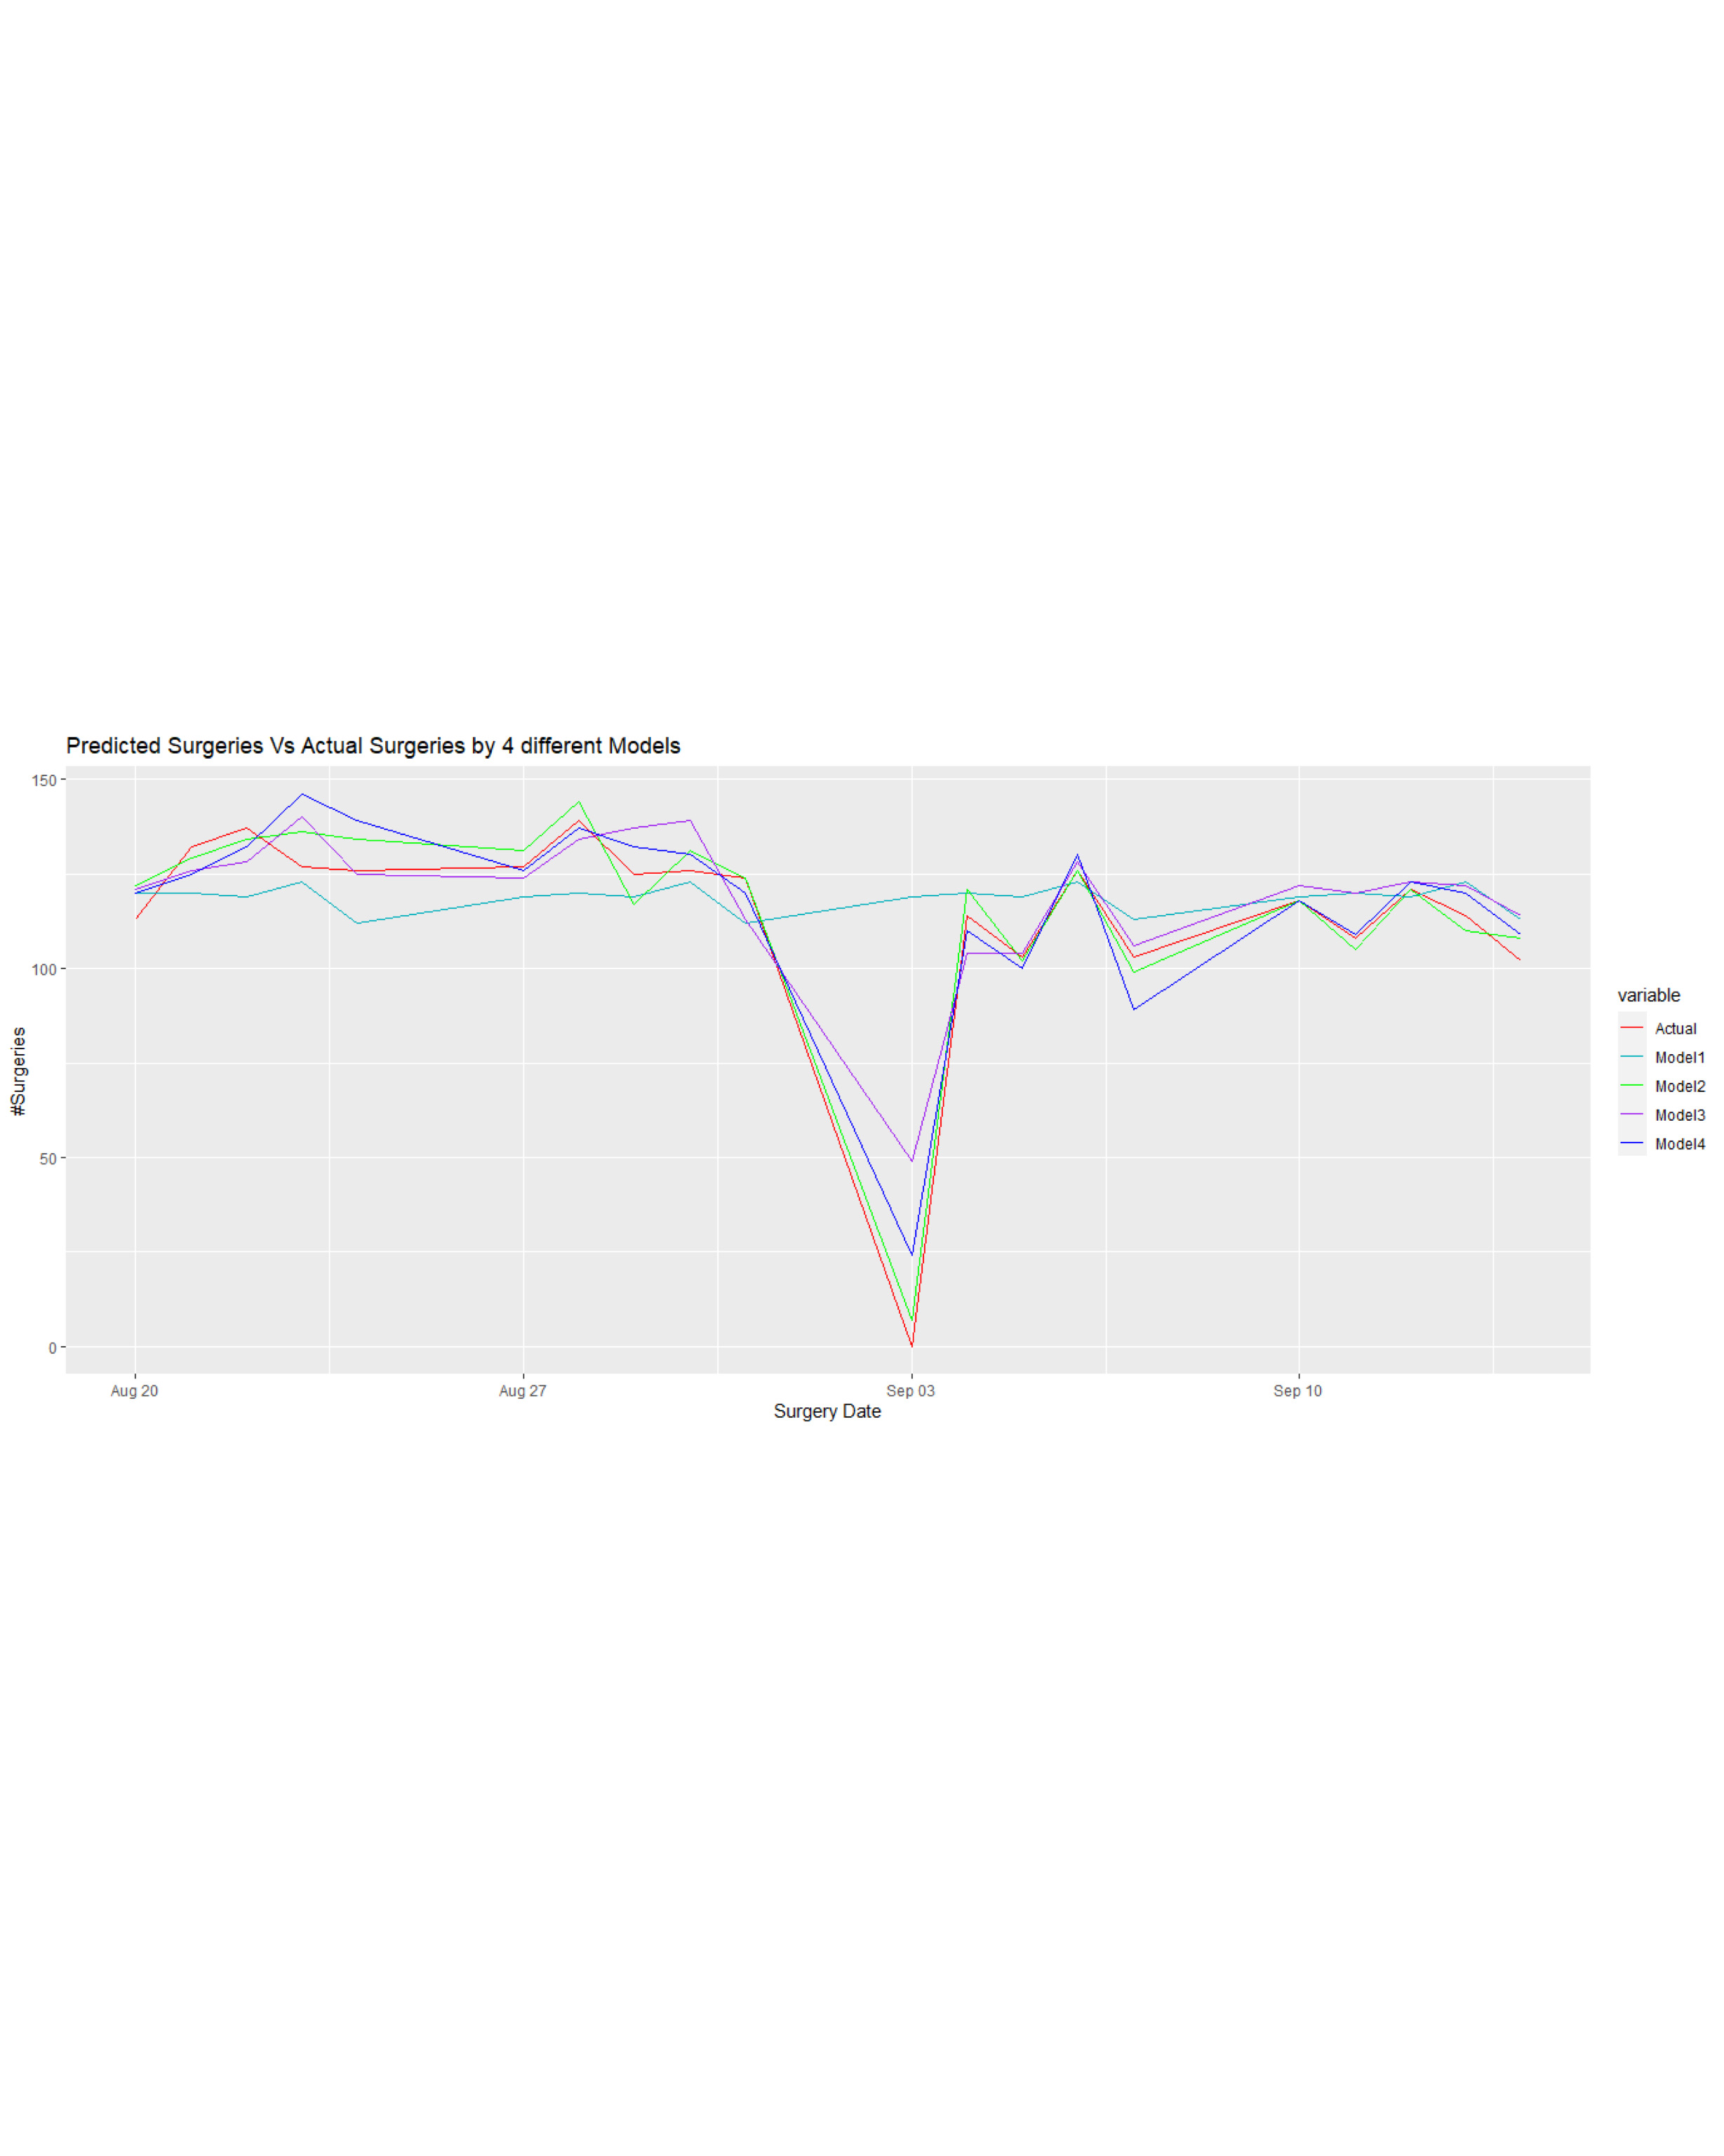
Developed a time series model for predicting daily case volume using 45 weeks of data. Built a model to forecast the demand two weeks ahead of time;achieved an adjusted R-squared value of 85.8% with RMSE value of 8.58 and MAE value of 6.462.

Analyzed Black Friday's consumer and transaction dataset containing 12 features and 537557 observations.
Performed data cleansing, model comparison and discovered that male unmarried in the age group of 40 – 50, certain occupation types, and city category C predominantly influence the purchase amount.
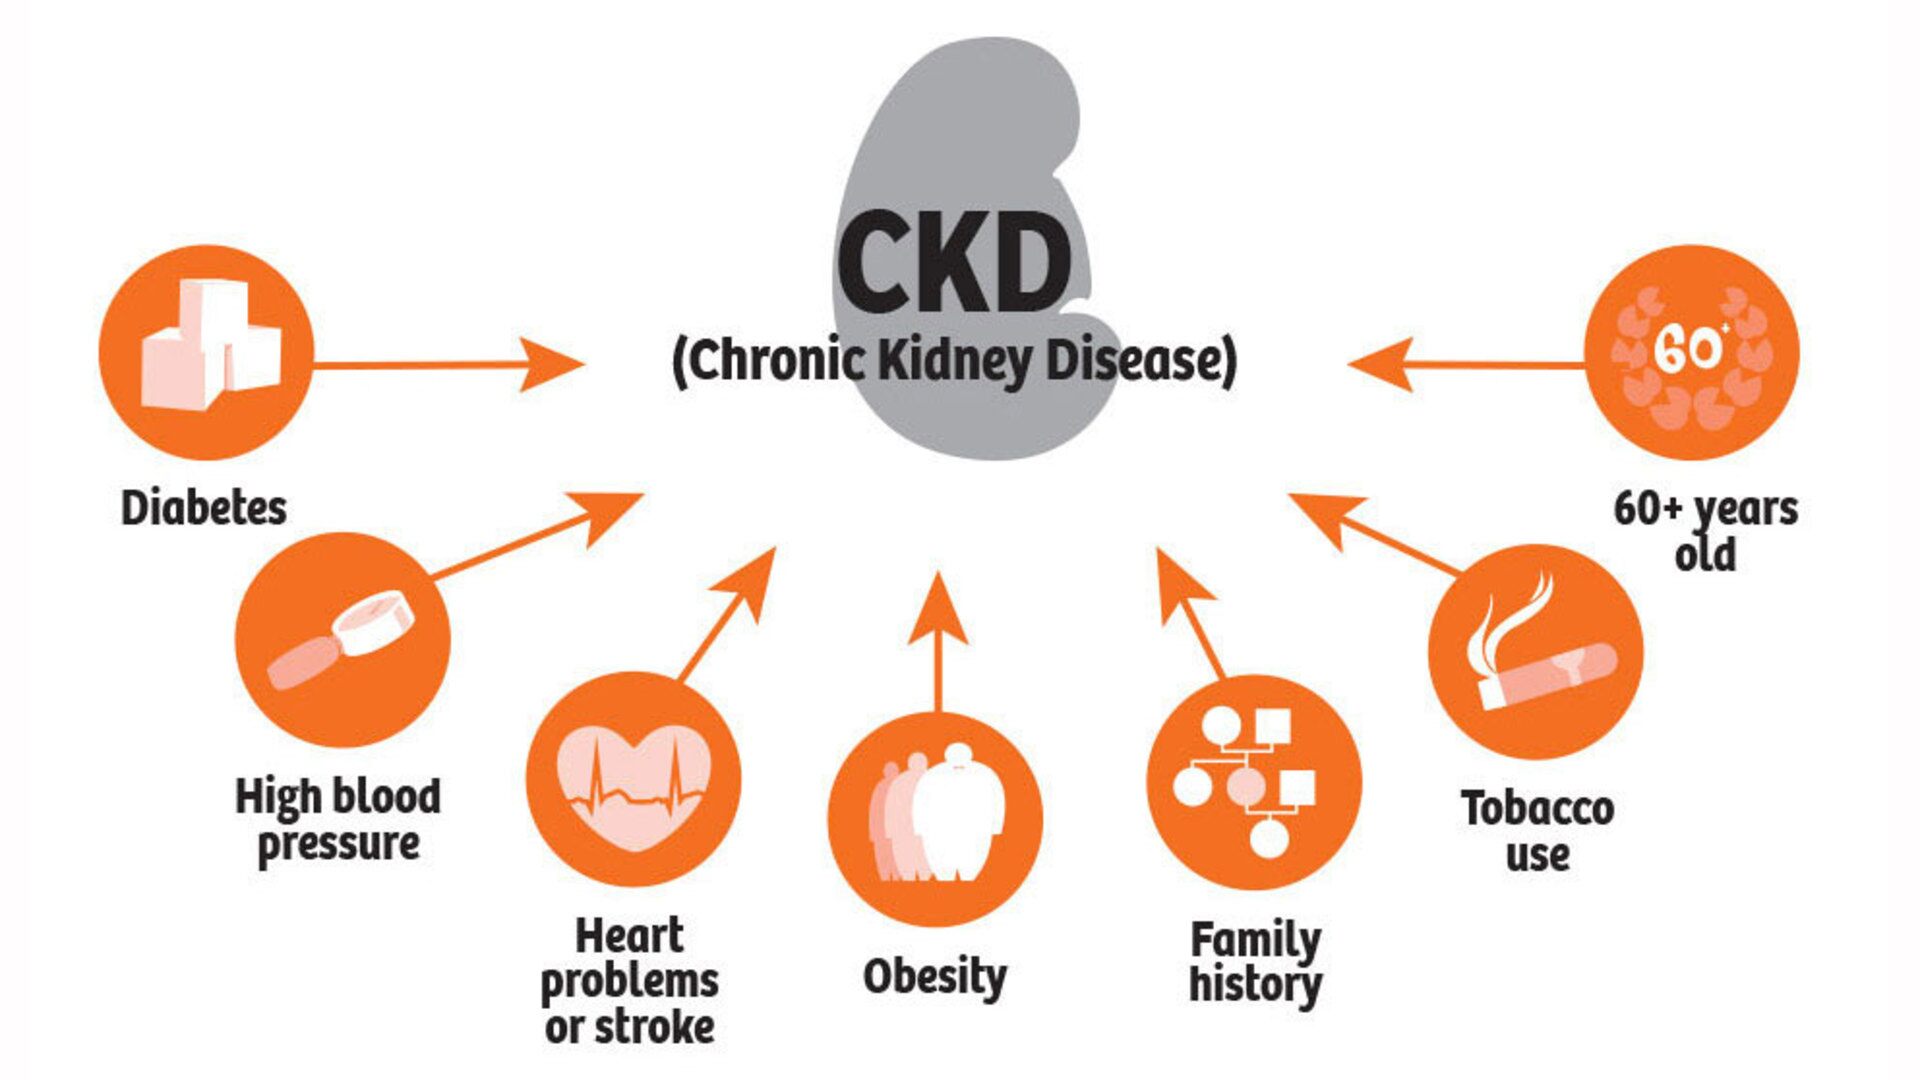
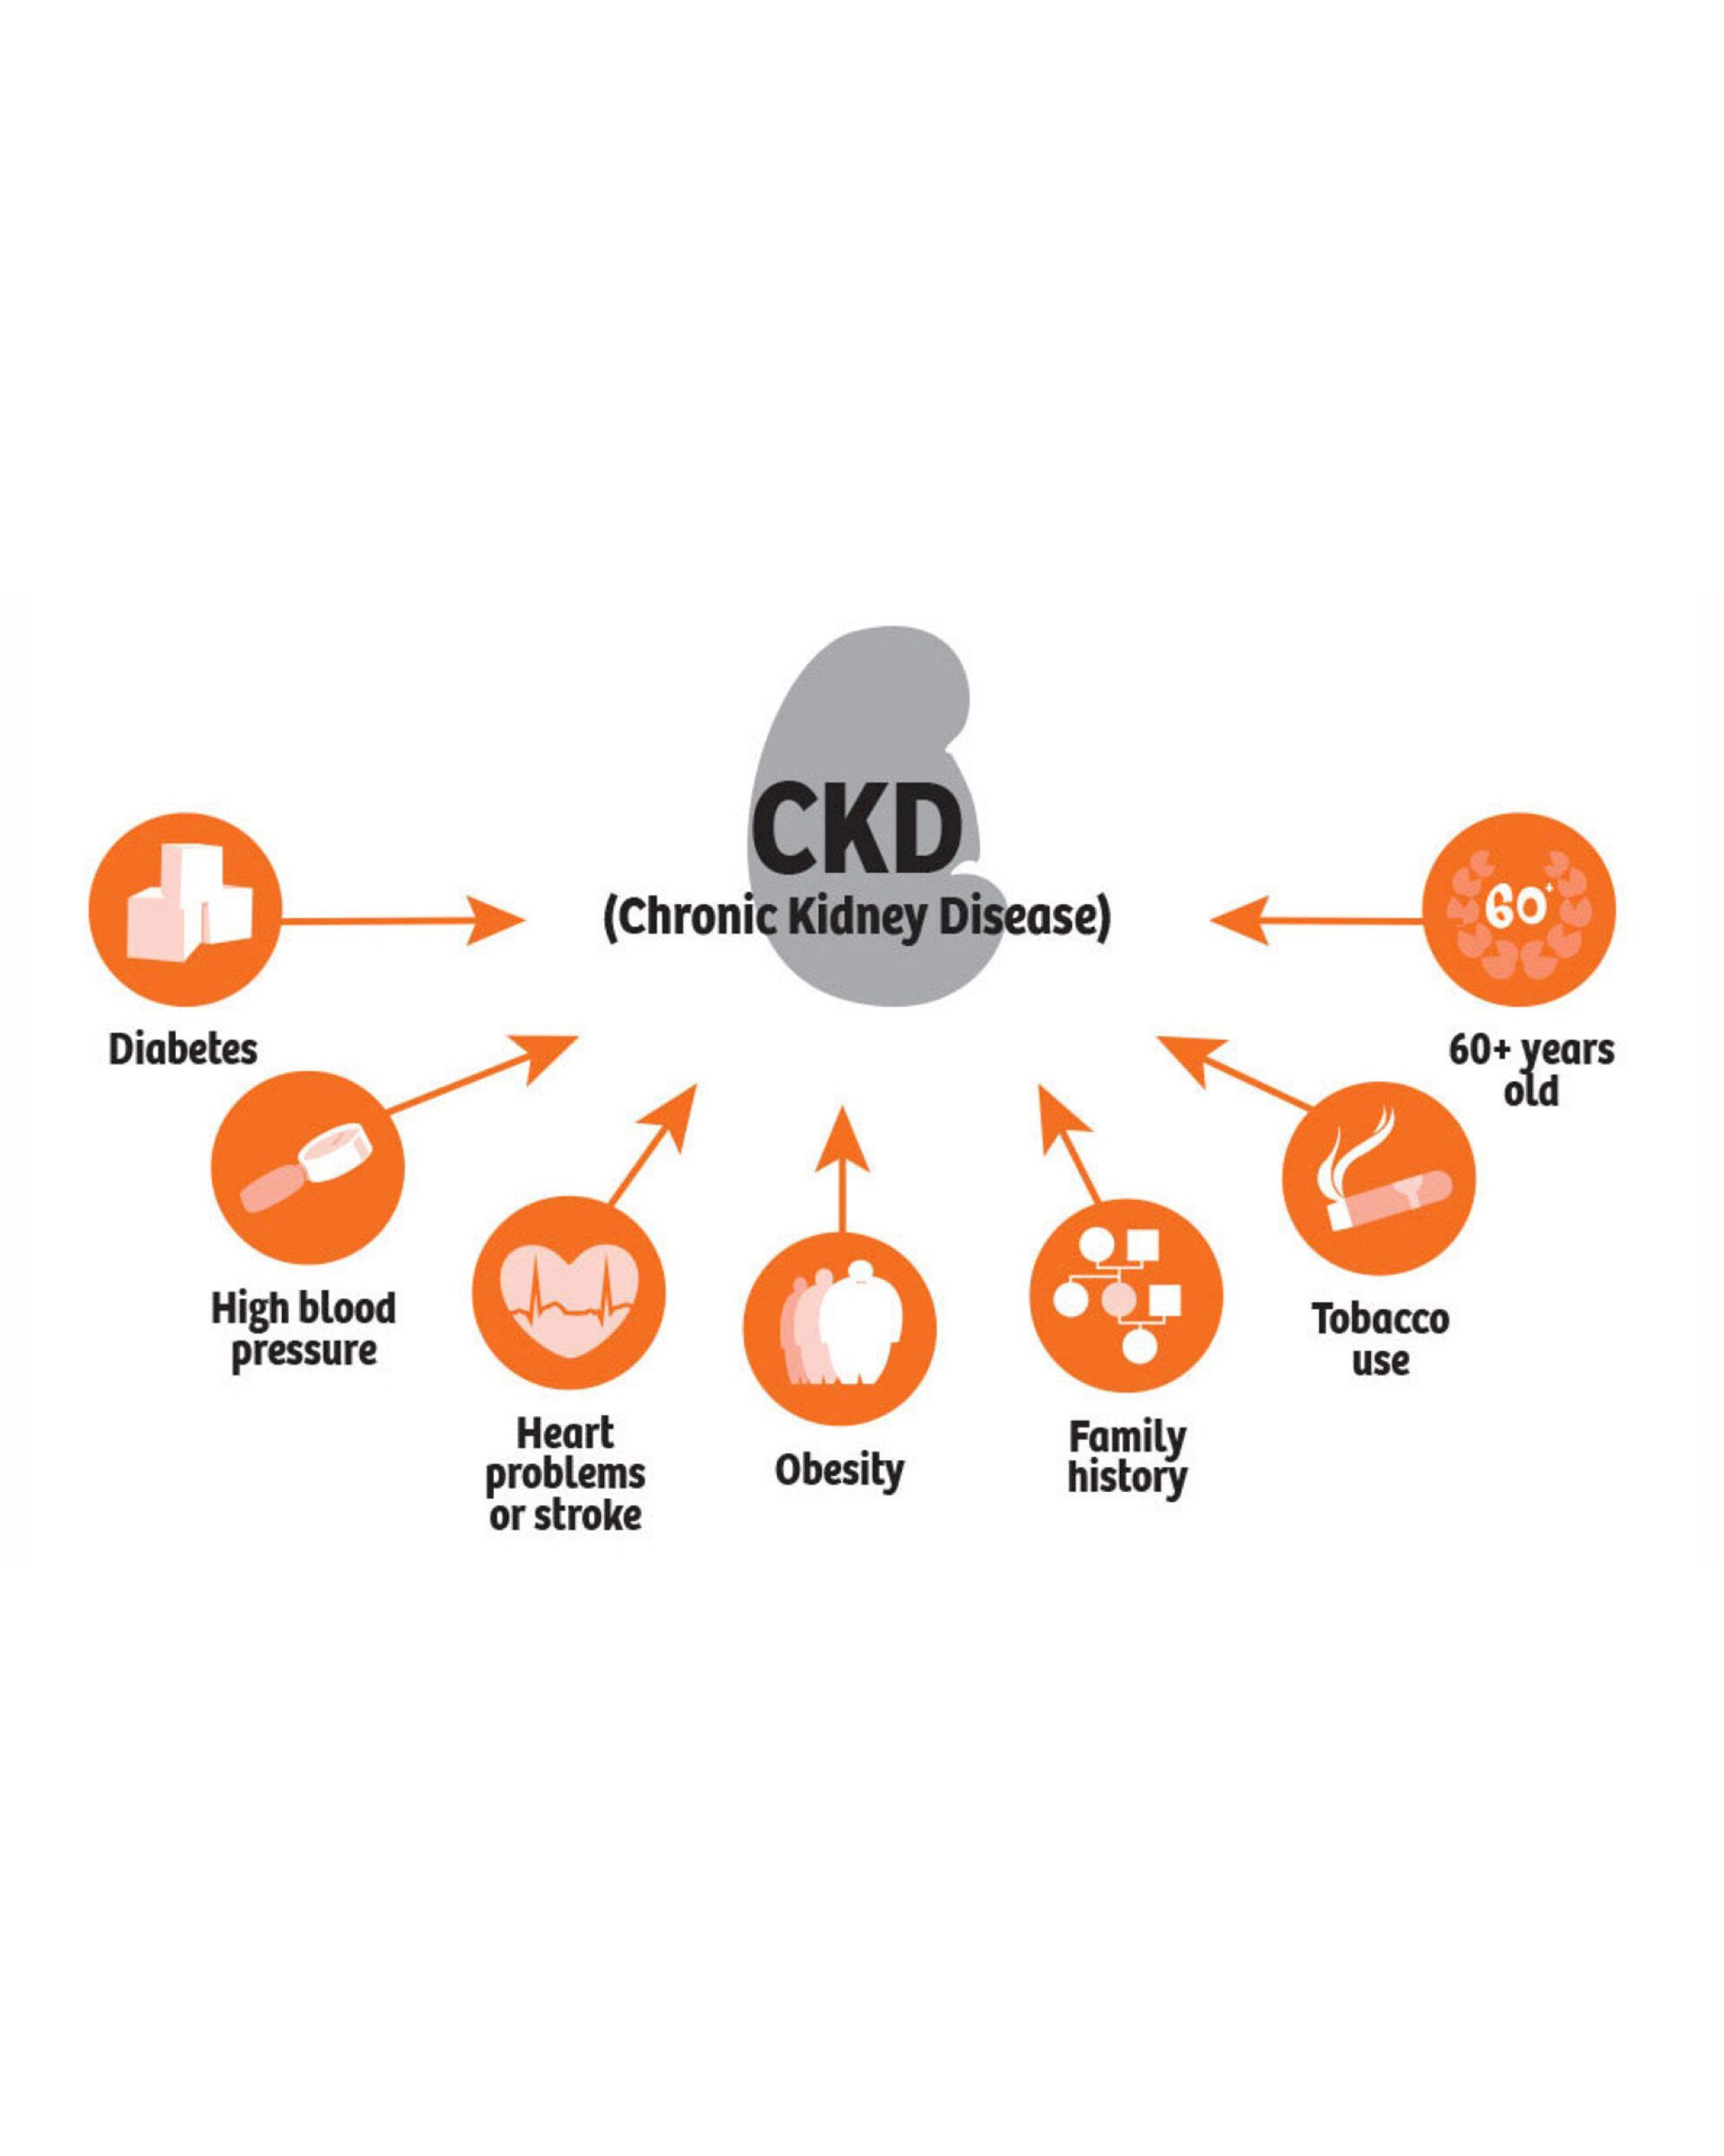
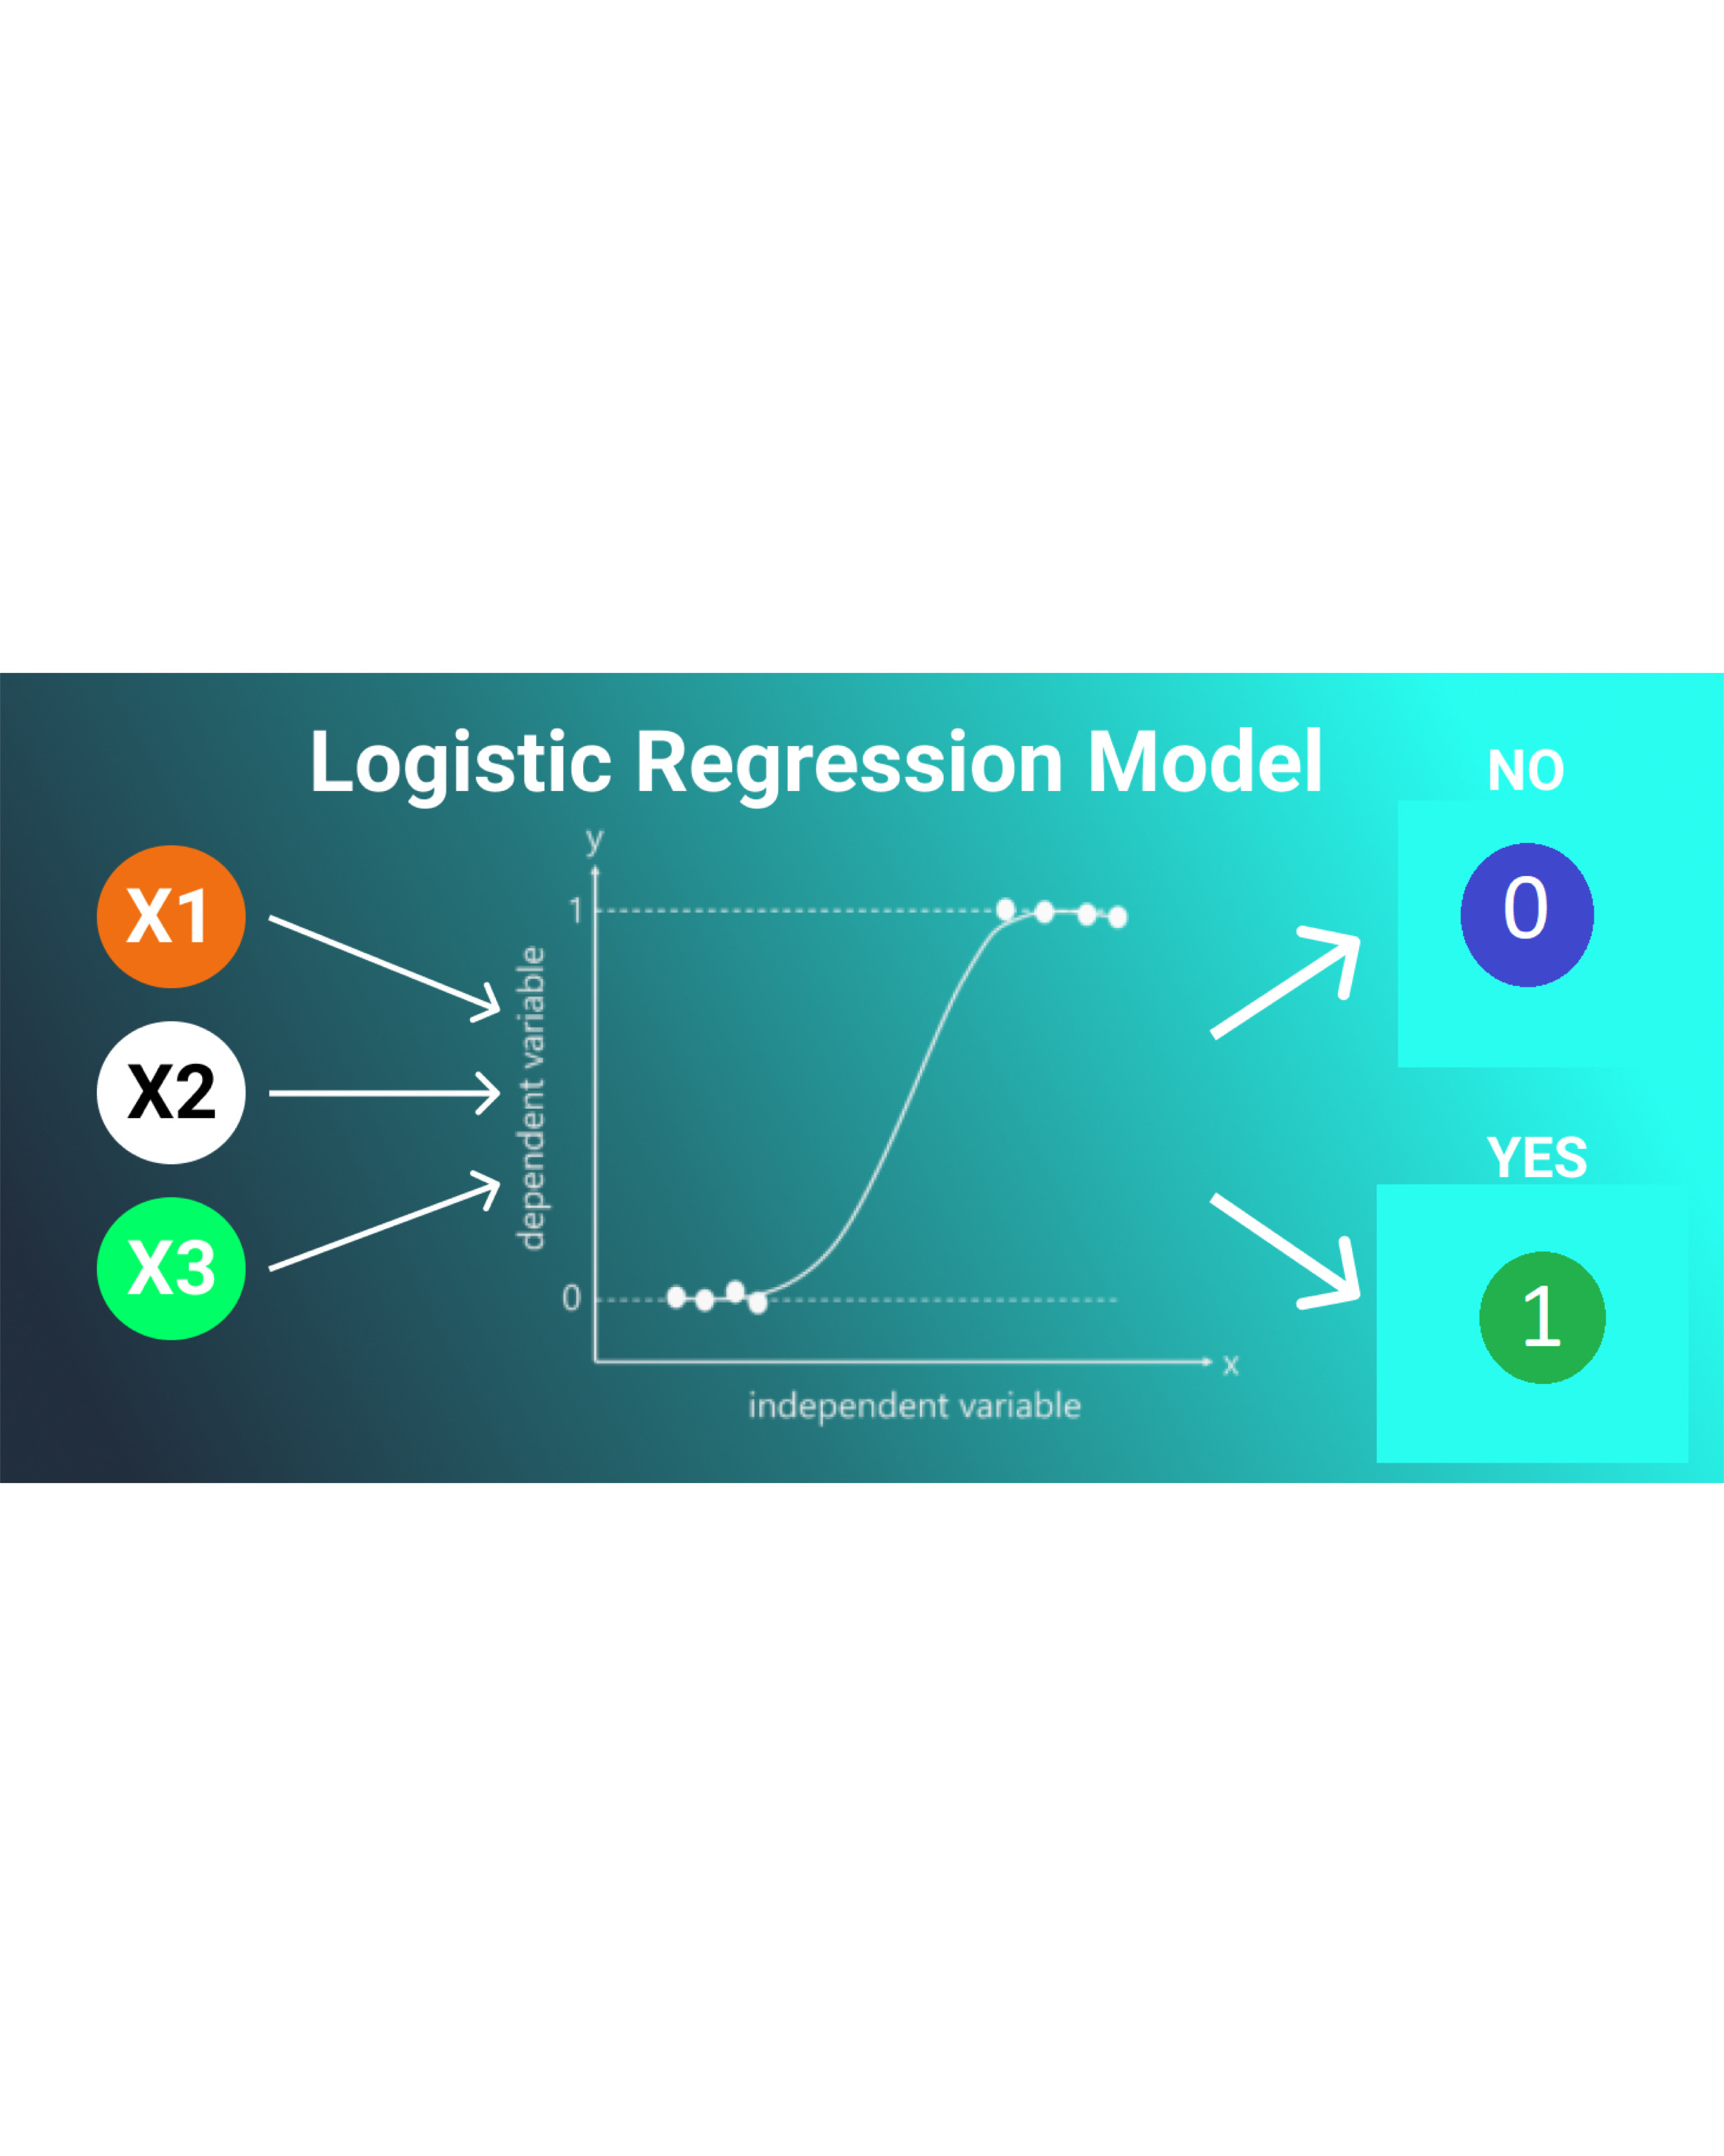
Analyzed dataset containing 6000 records of training data and predicted 2819 records of test data containing 33 indicator variables. Built a forward step-wise logistic regression model in SPSS to predict the risk of a patient getting Chronic Kidney Disease.
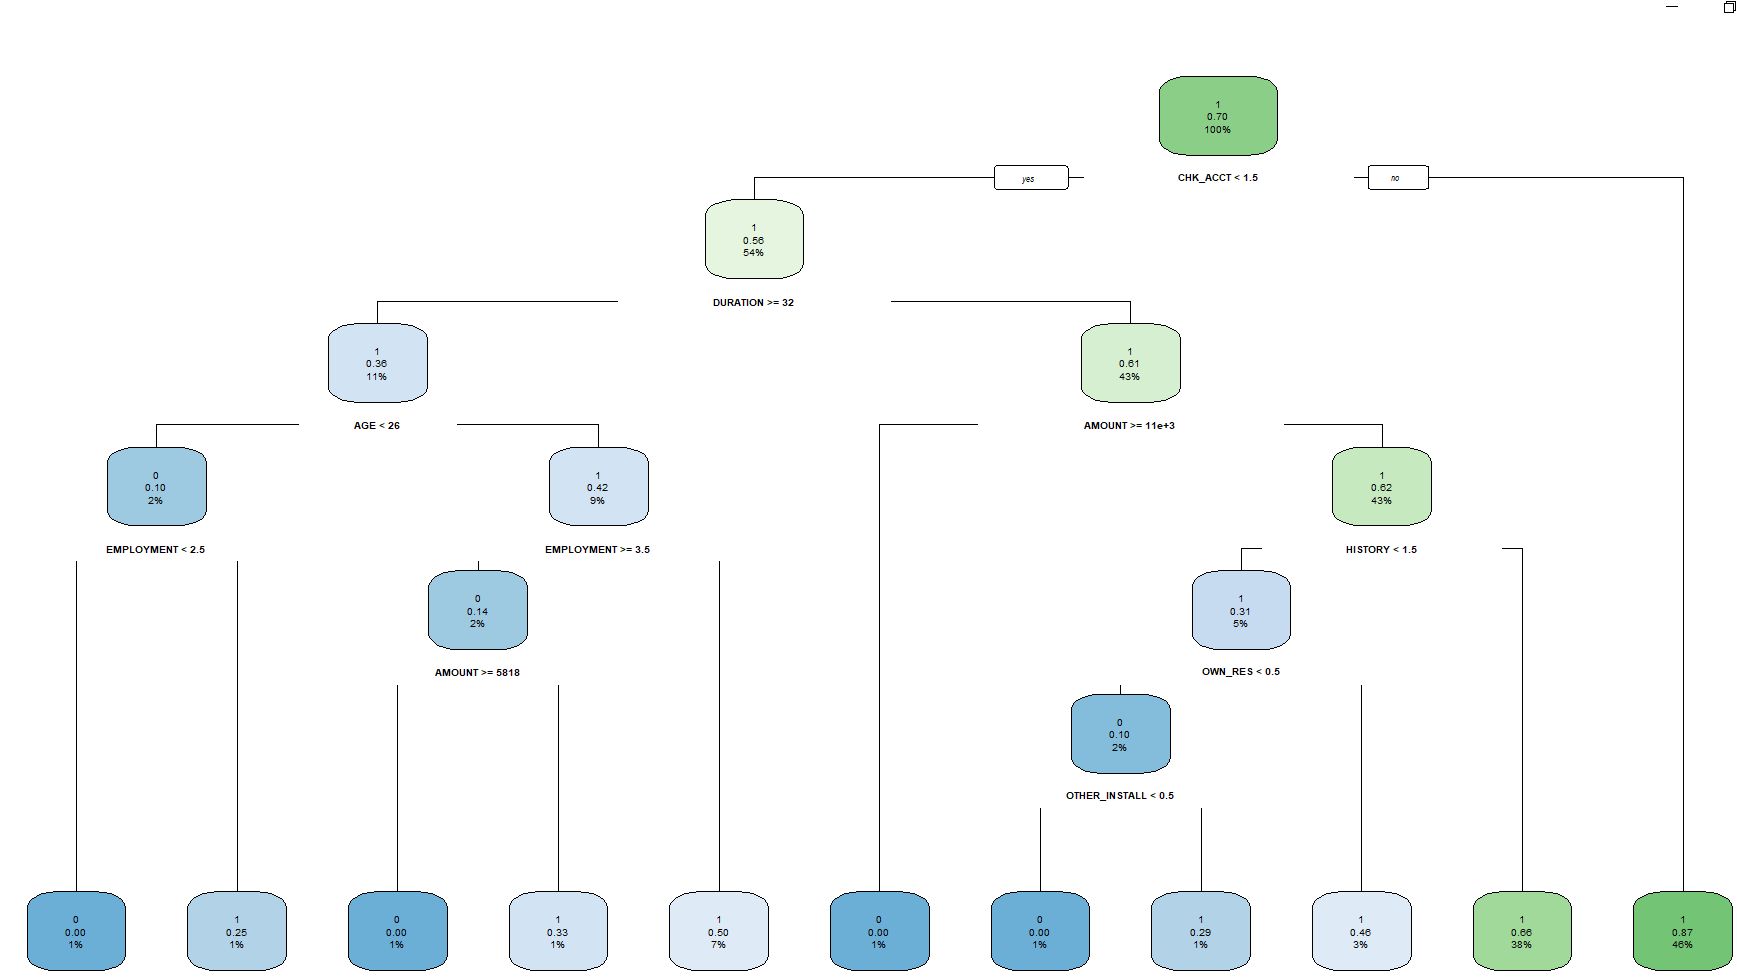
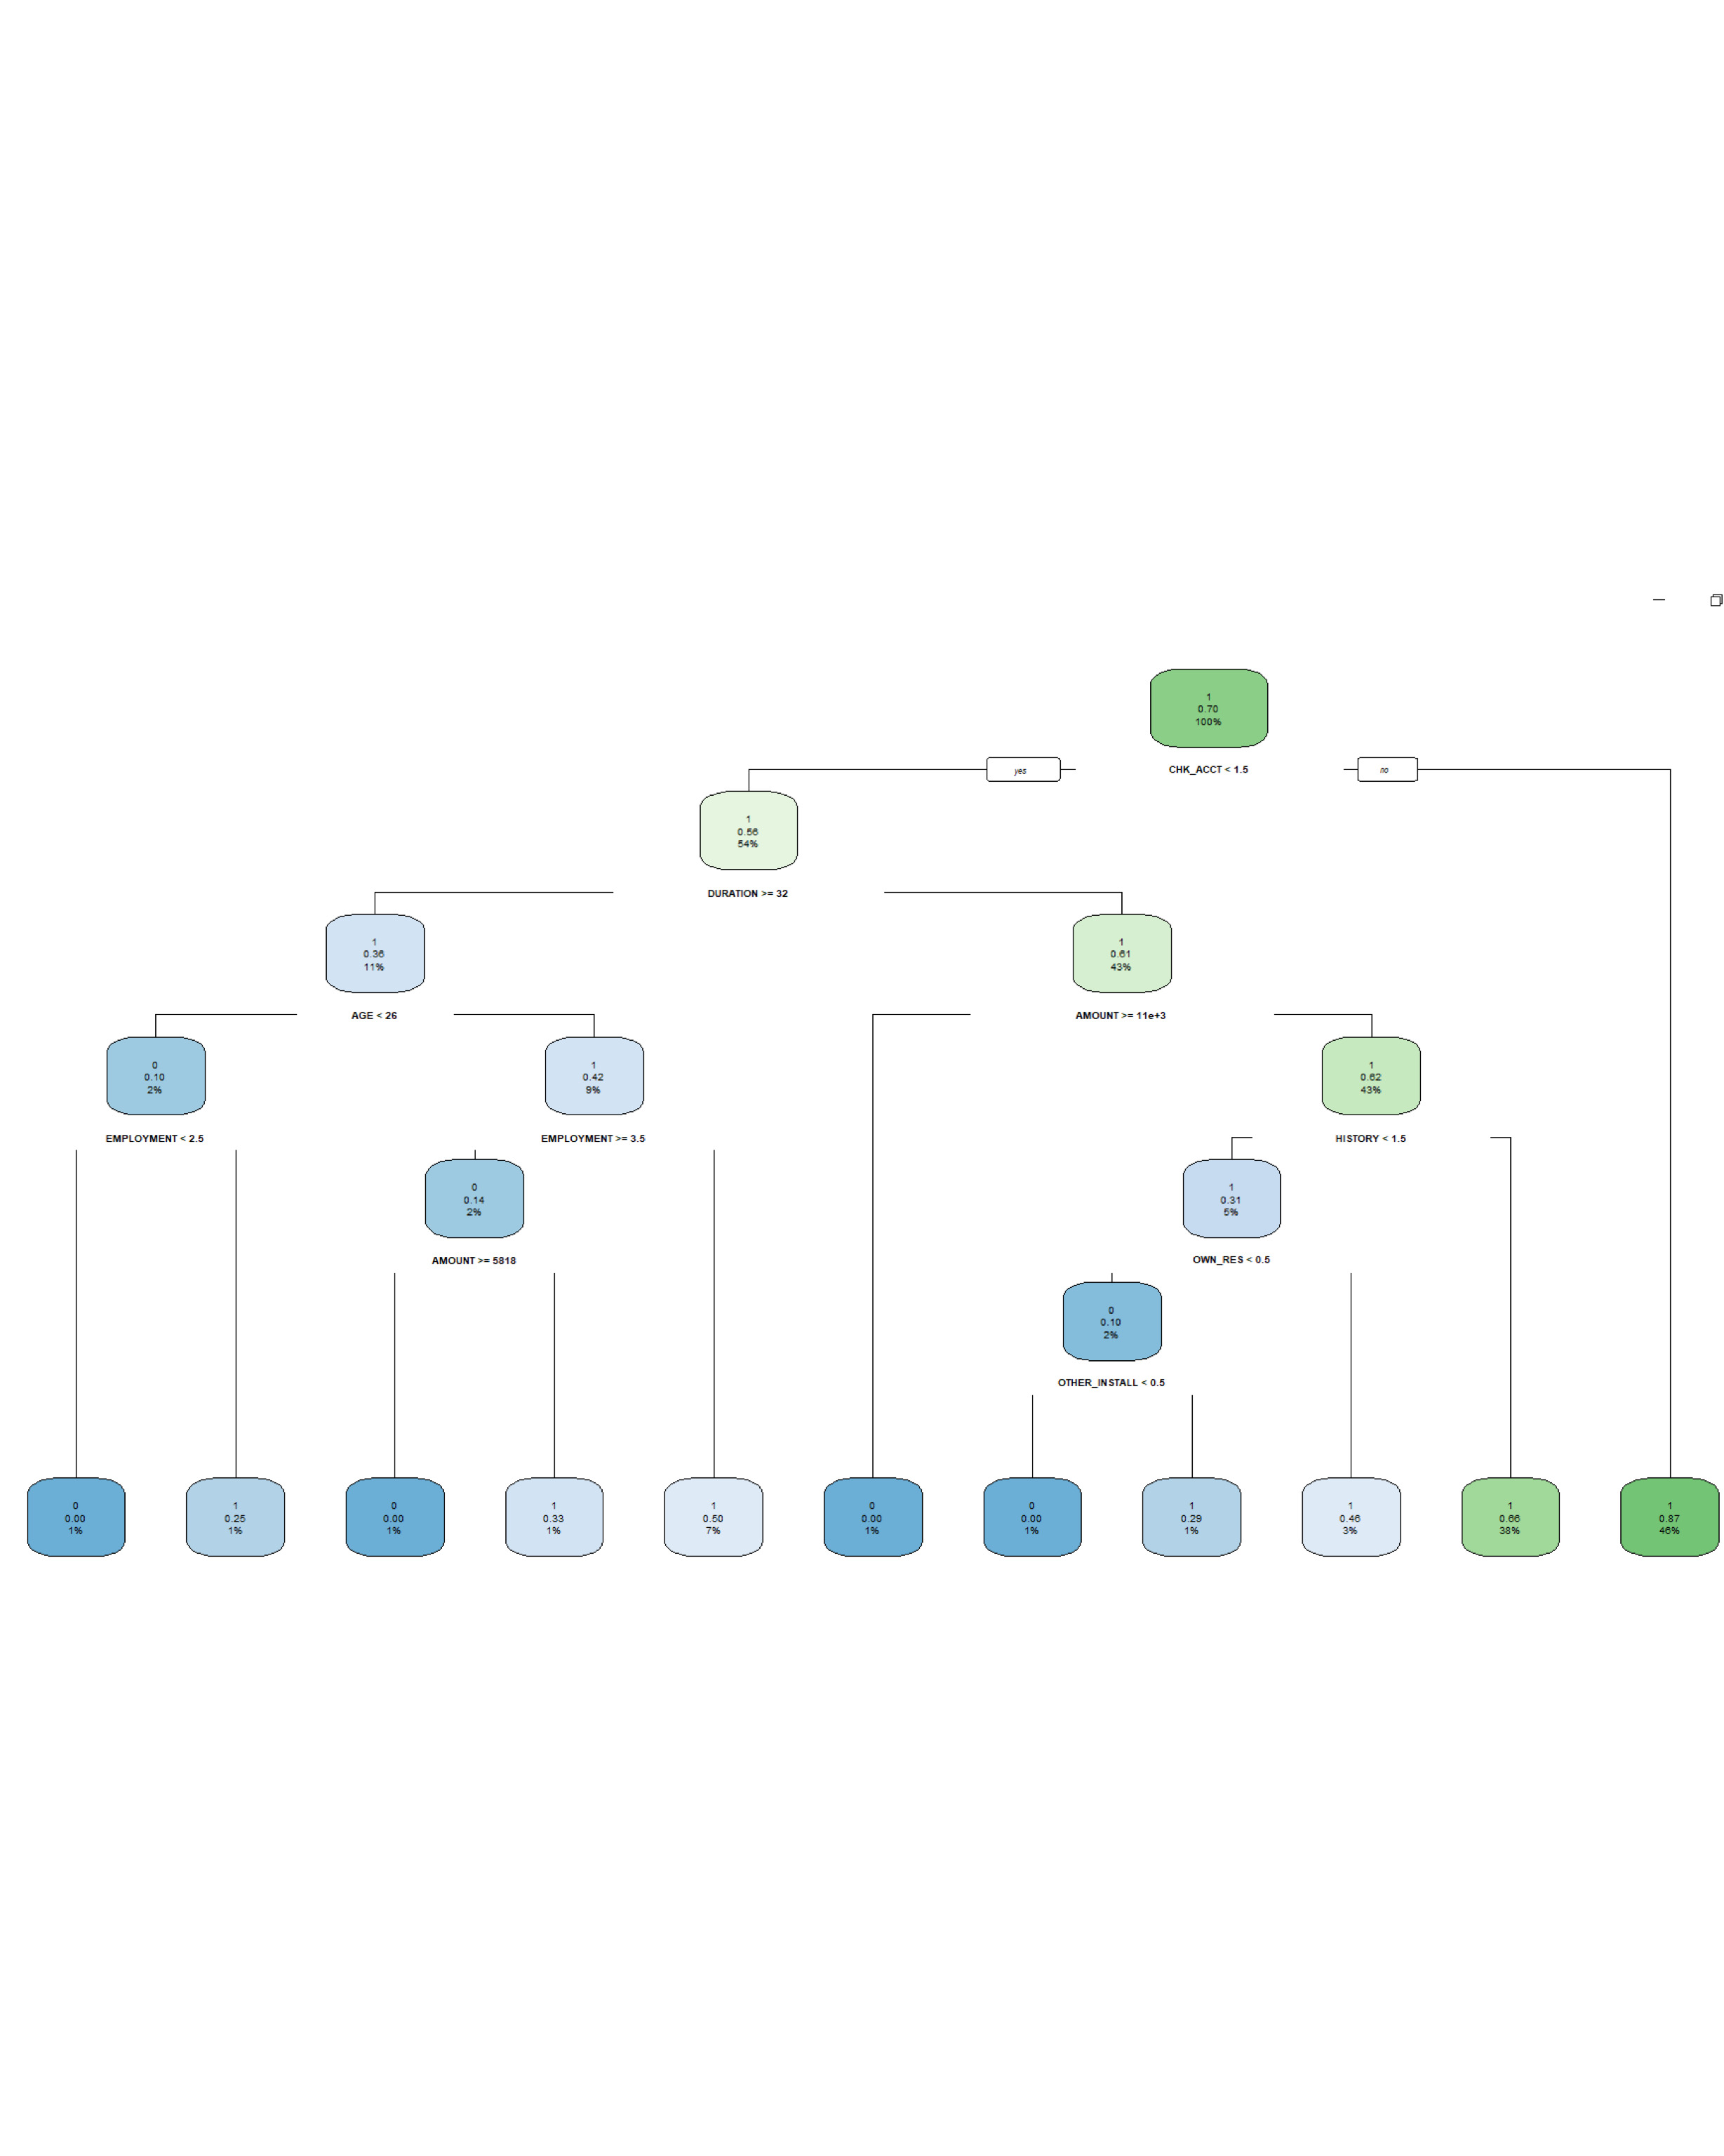
Analyzed dataset containing 30 predictor variables and 1000 observations while considering the cost of misclassification using loss function.
Performed EDA and built a Decision Tree model to classify whether a new applicant is a good credit or a bad credit.
Evaluated the model with and without opportunity cost and observed a 10% decrease in the false alarm rate & a 10% increase in specificity in the test data.
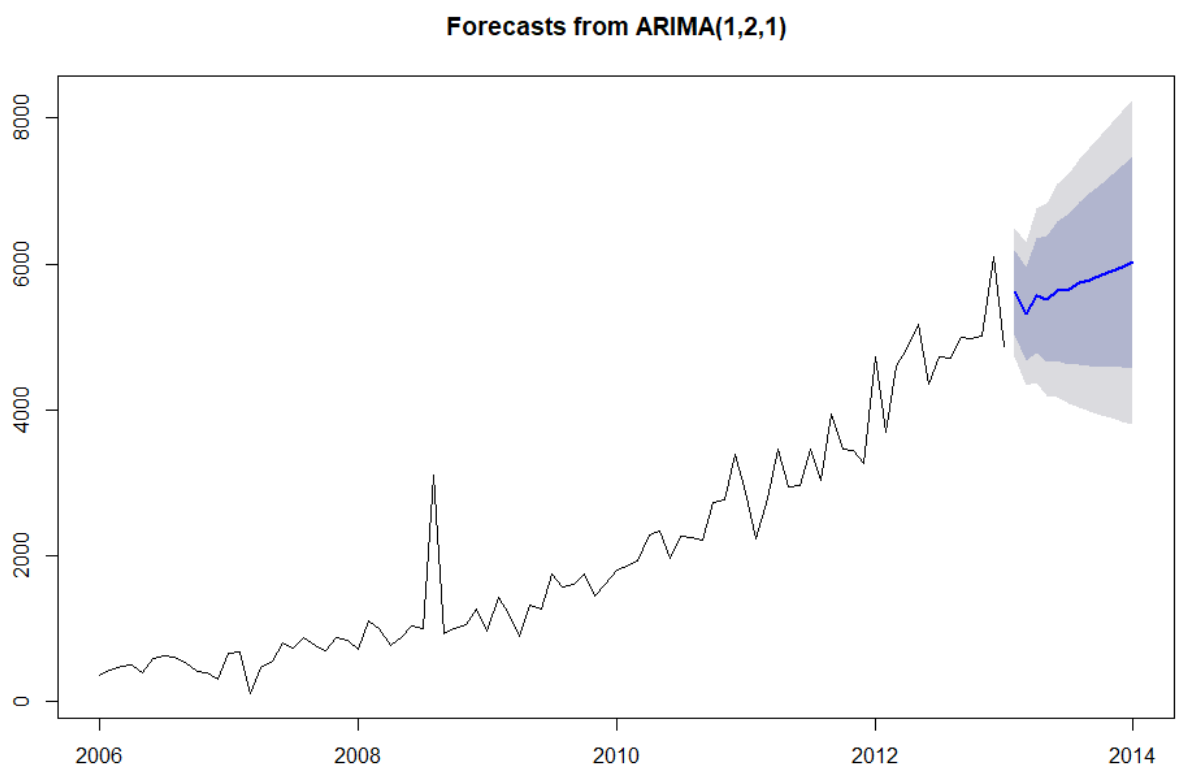
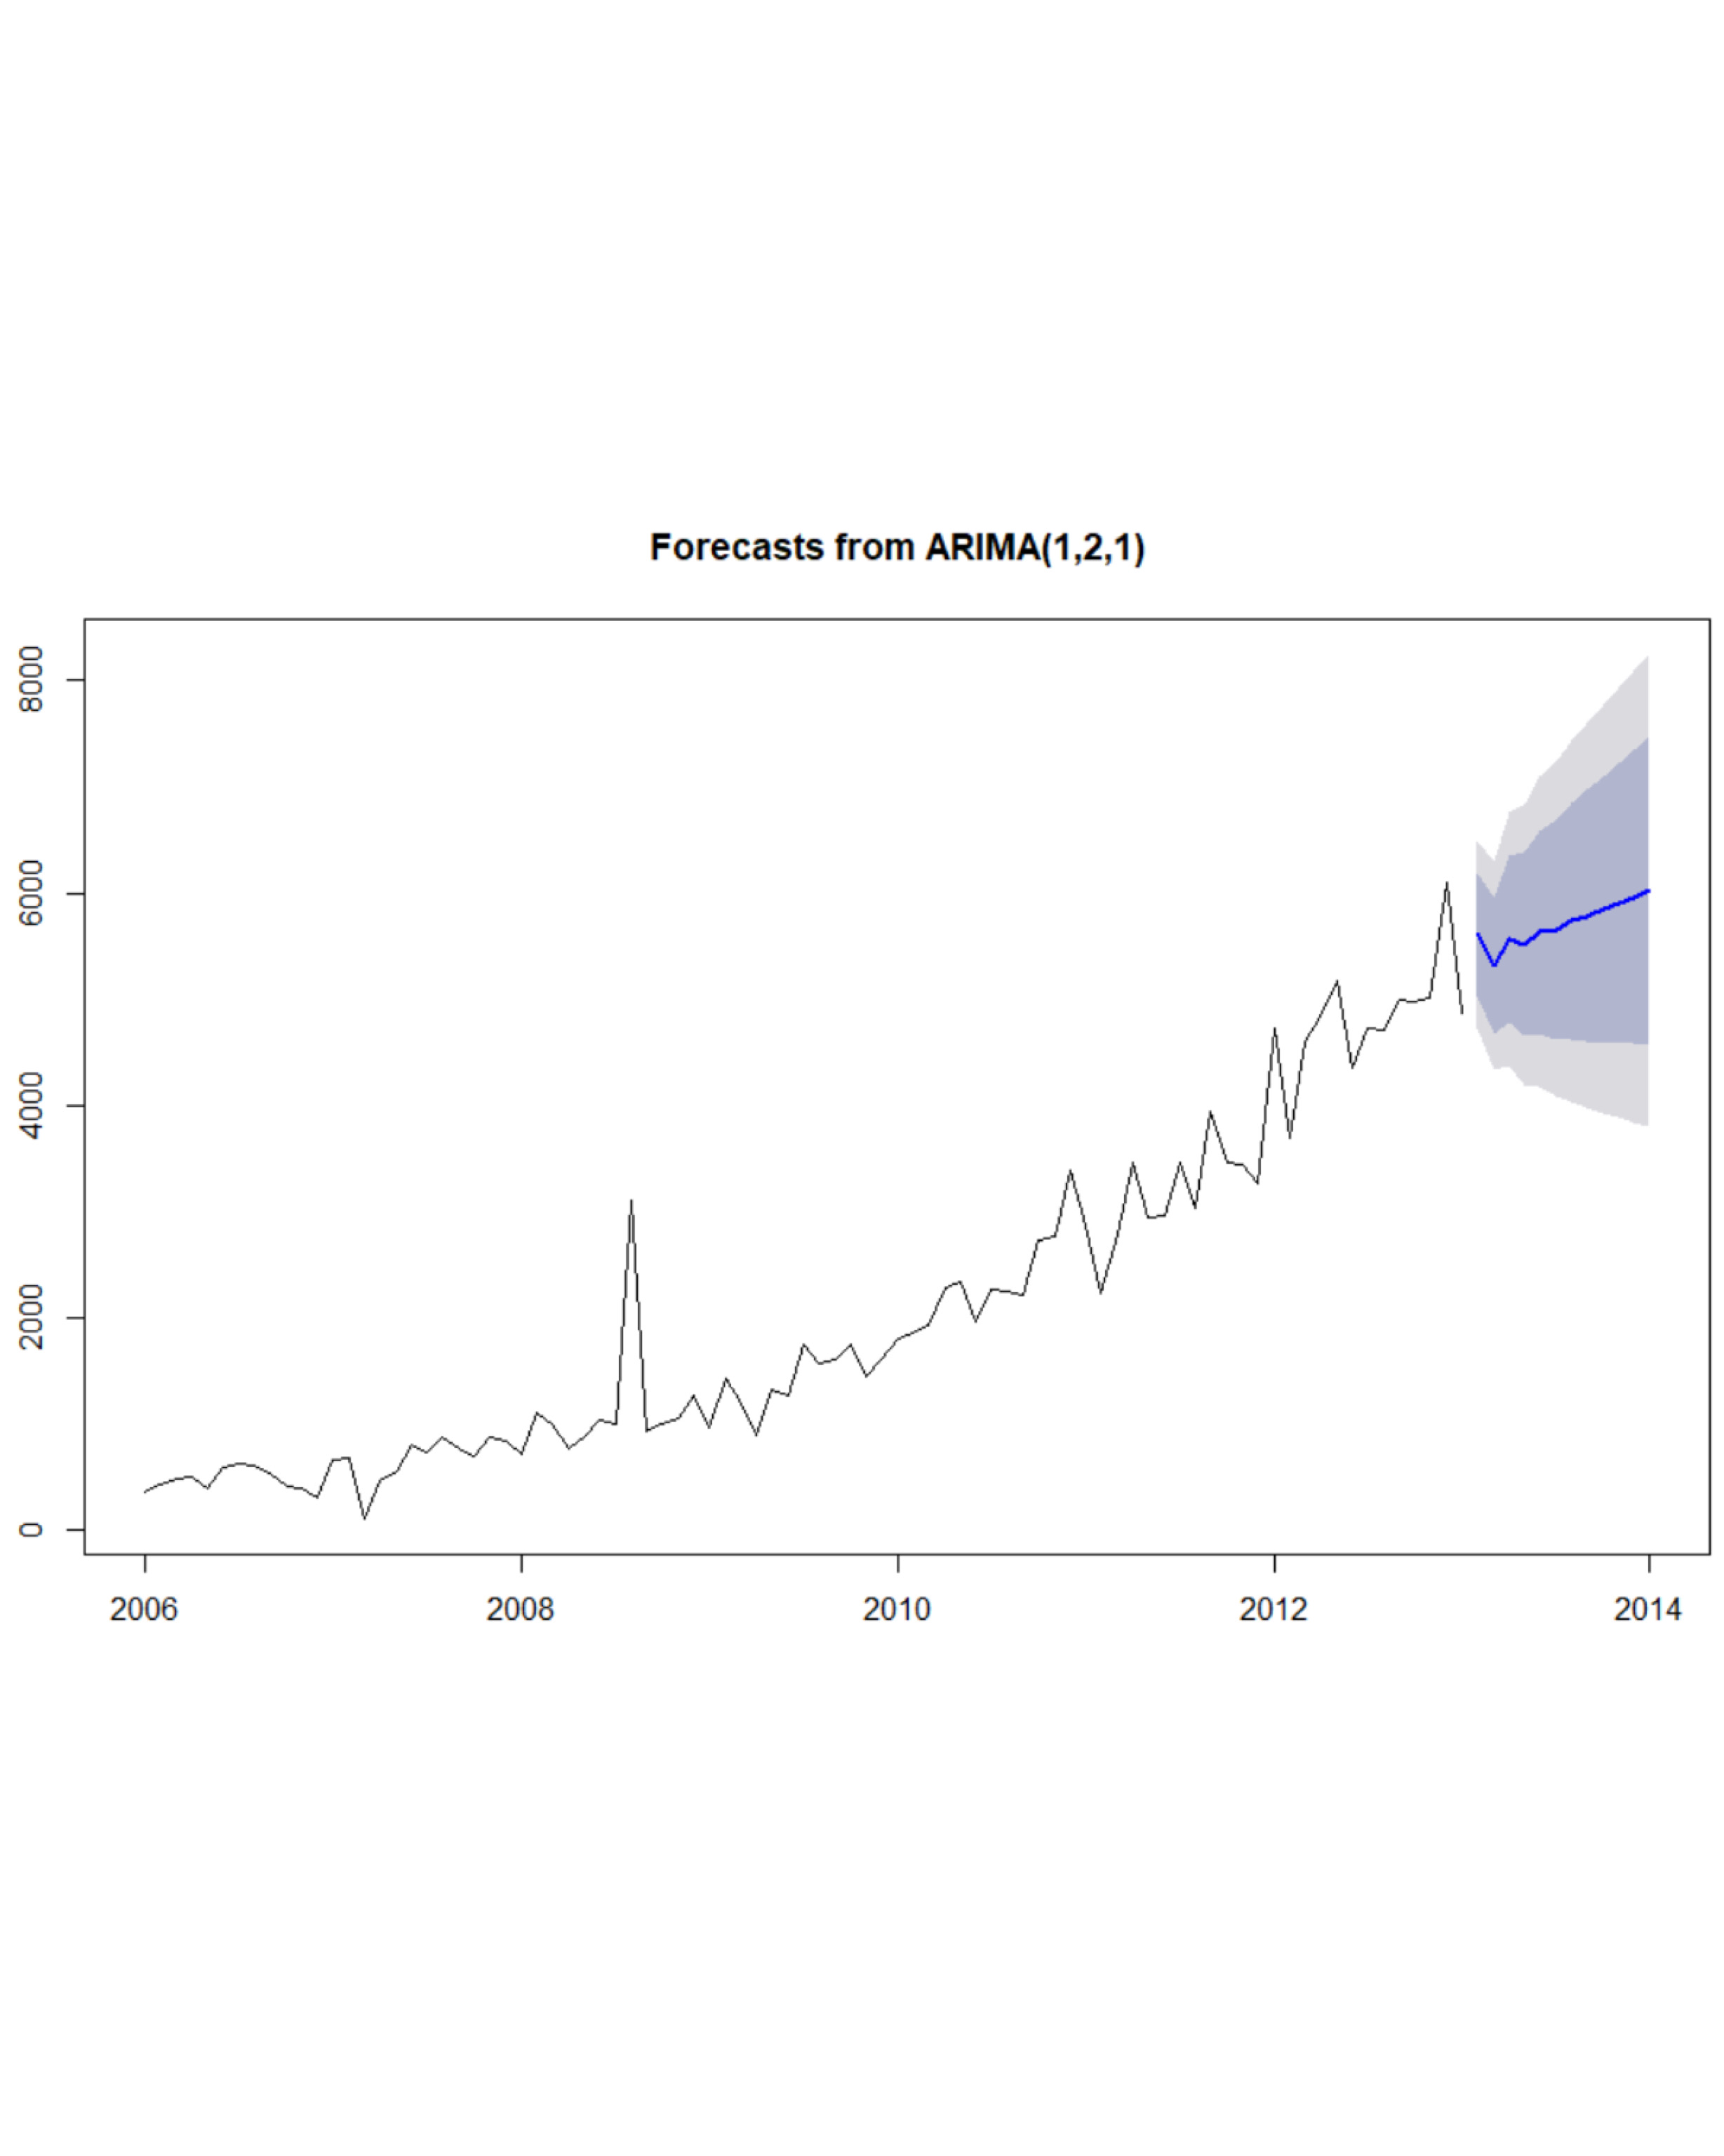
Predicted the incoming cardiovascular examination volume at Abbeville HC using ARIMA model. Validated all the assumptions underlying ARIMA model and forecasted the number of Cardiovascular examination volume by analyzing 8 years of exam records at the Abbeville HC.
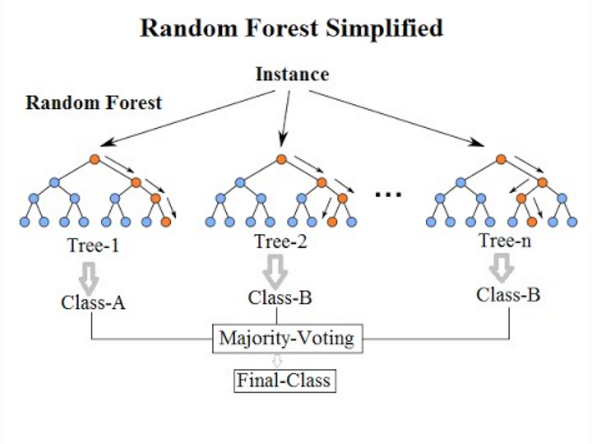
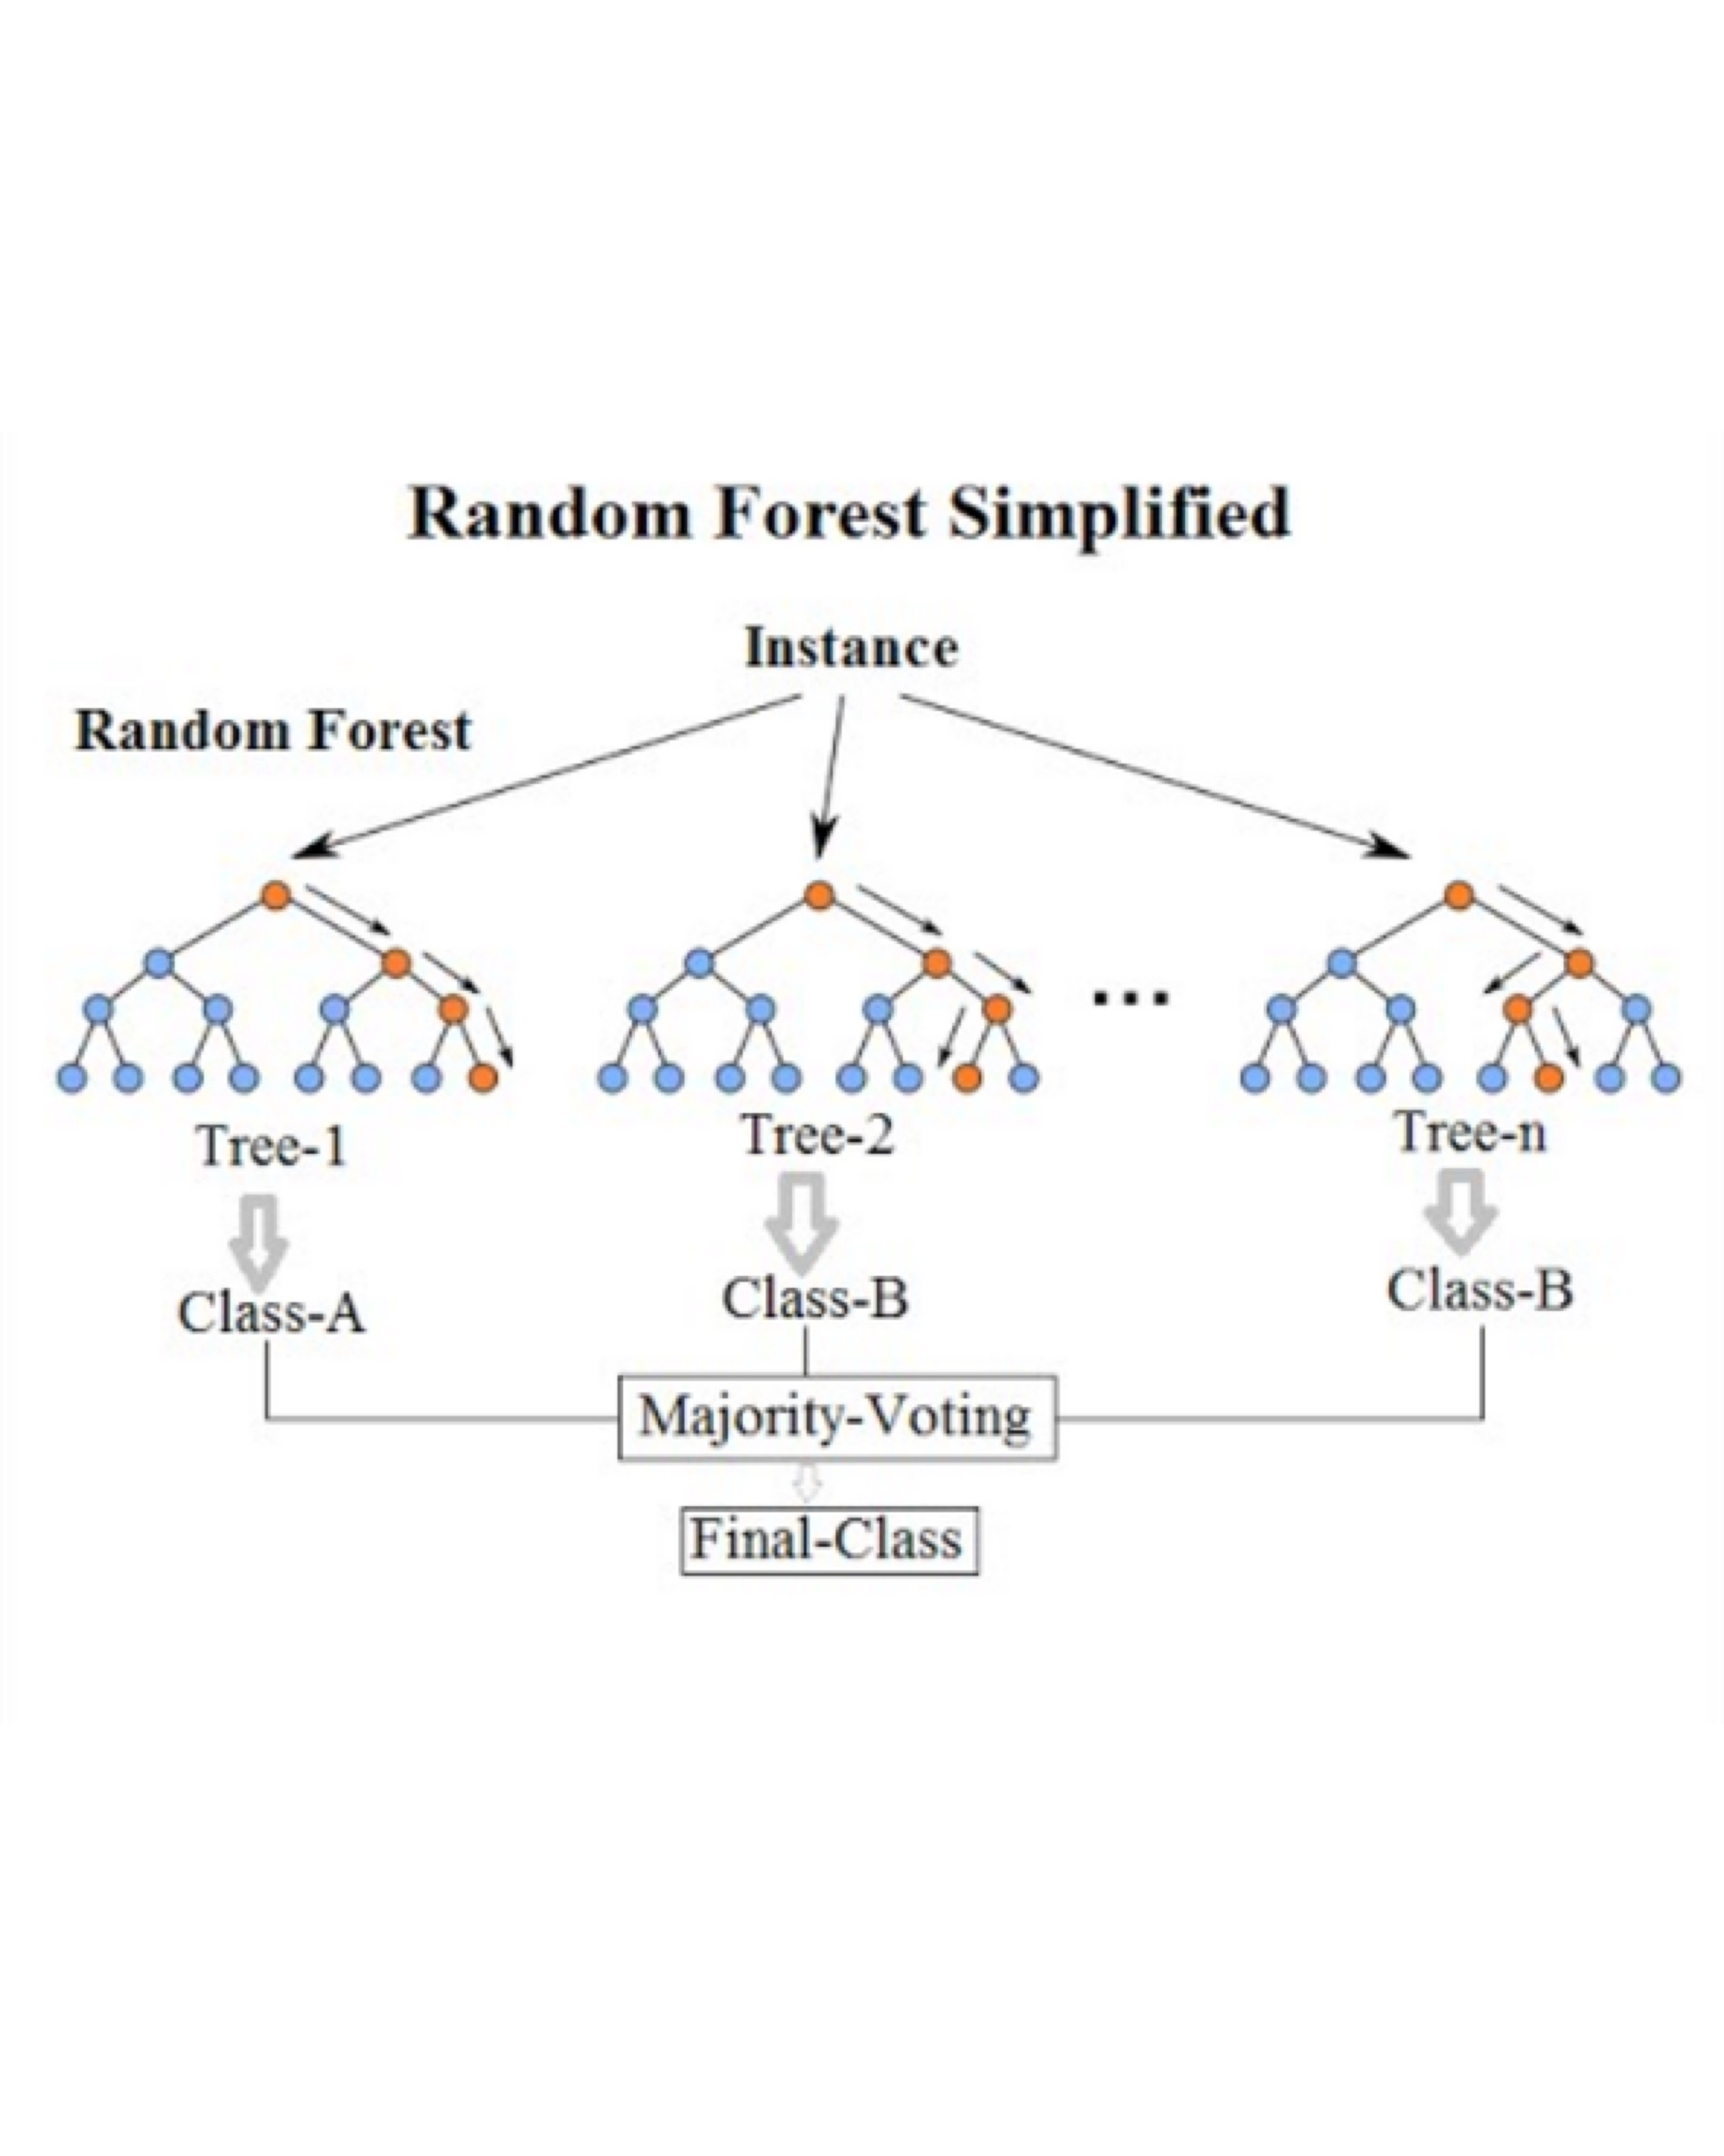
Analyzed dataset containing 86 predictor variables & 9000 observations while tuning hyperparameters to choose optimal sample size, mtry and n0.
Performed factor level reduction & built the RF model with 94% accuracy & 6.18% OOB error rate and identified 281 insurance holders.
Analyzed 248 patient’s health data containing 41 features and identified 8 key factors that affect the treatment cost.
Built a multiple regression model using Mission Hospital data for predicting the package price/treatment costs at the time of patient admission.

Identified the top 10 categories of videos having the highest number of views, likes, comments, and ratings using 2 mappers and 2 reducers. Used PowerBI to visualize and compare the results to recommend the best video categories on YouTube
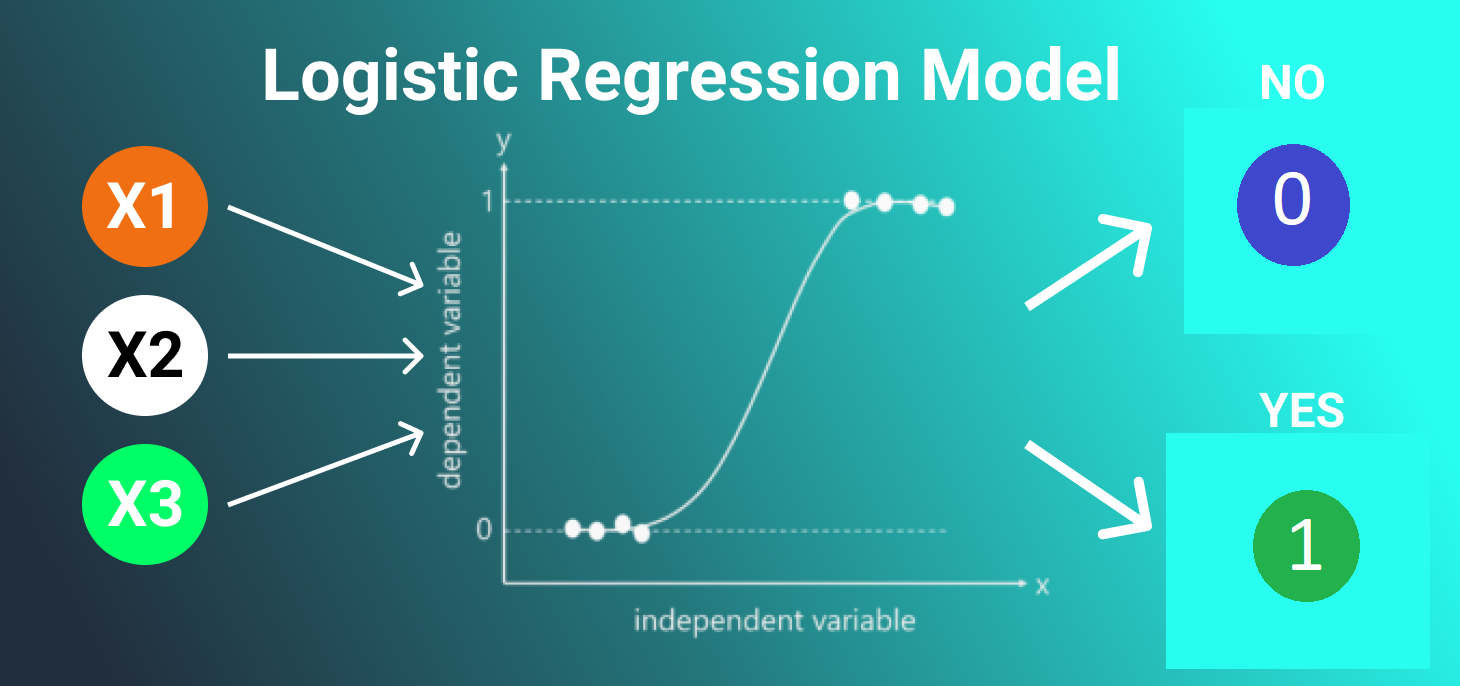
Analyzed 8955 patient records and their 34 features and identified the characteristics of prostate cancer survival after 7 years. Built a forward stepwise logistic regression model to identify the prostate cancer patients and predict the odds and risk of prostate cancer survival.
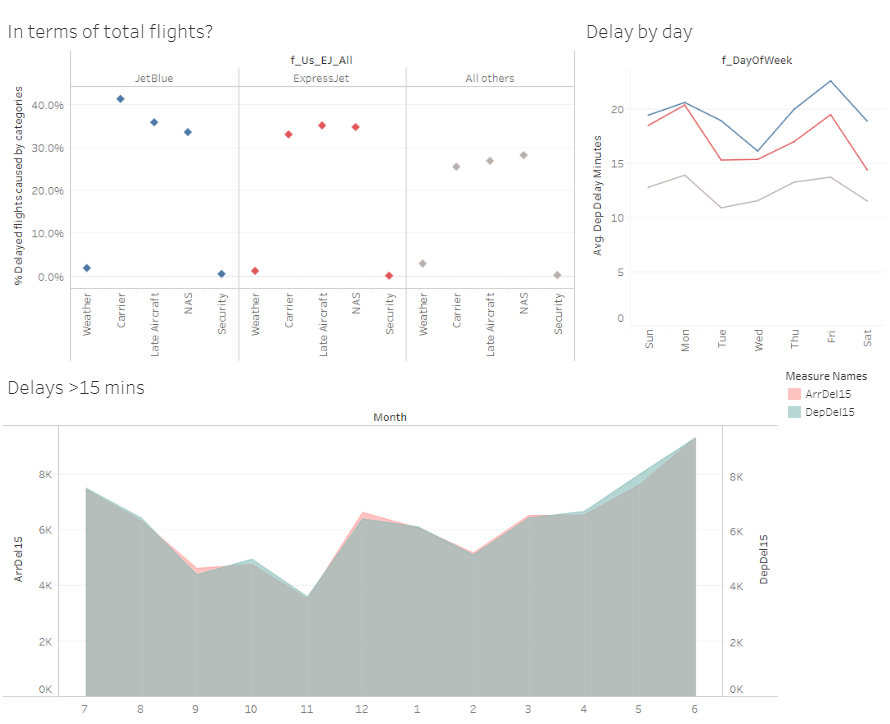
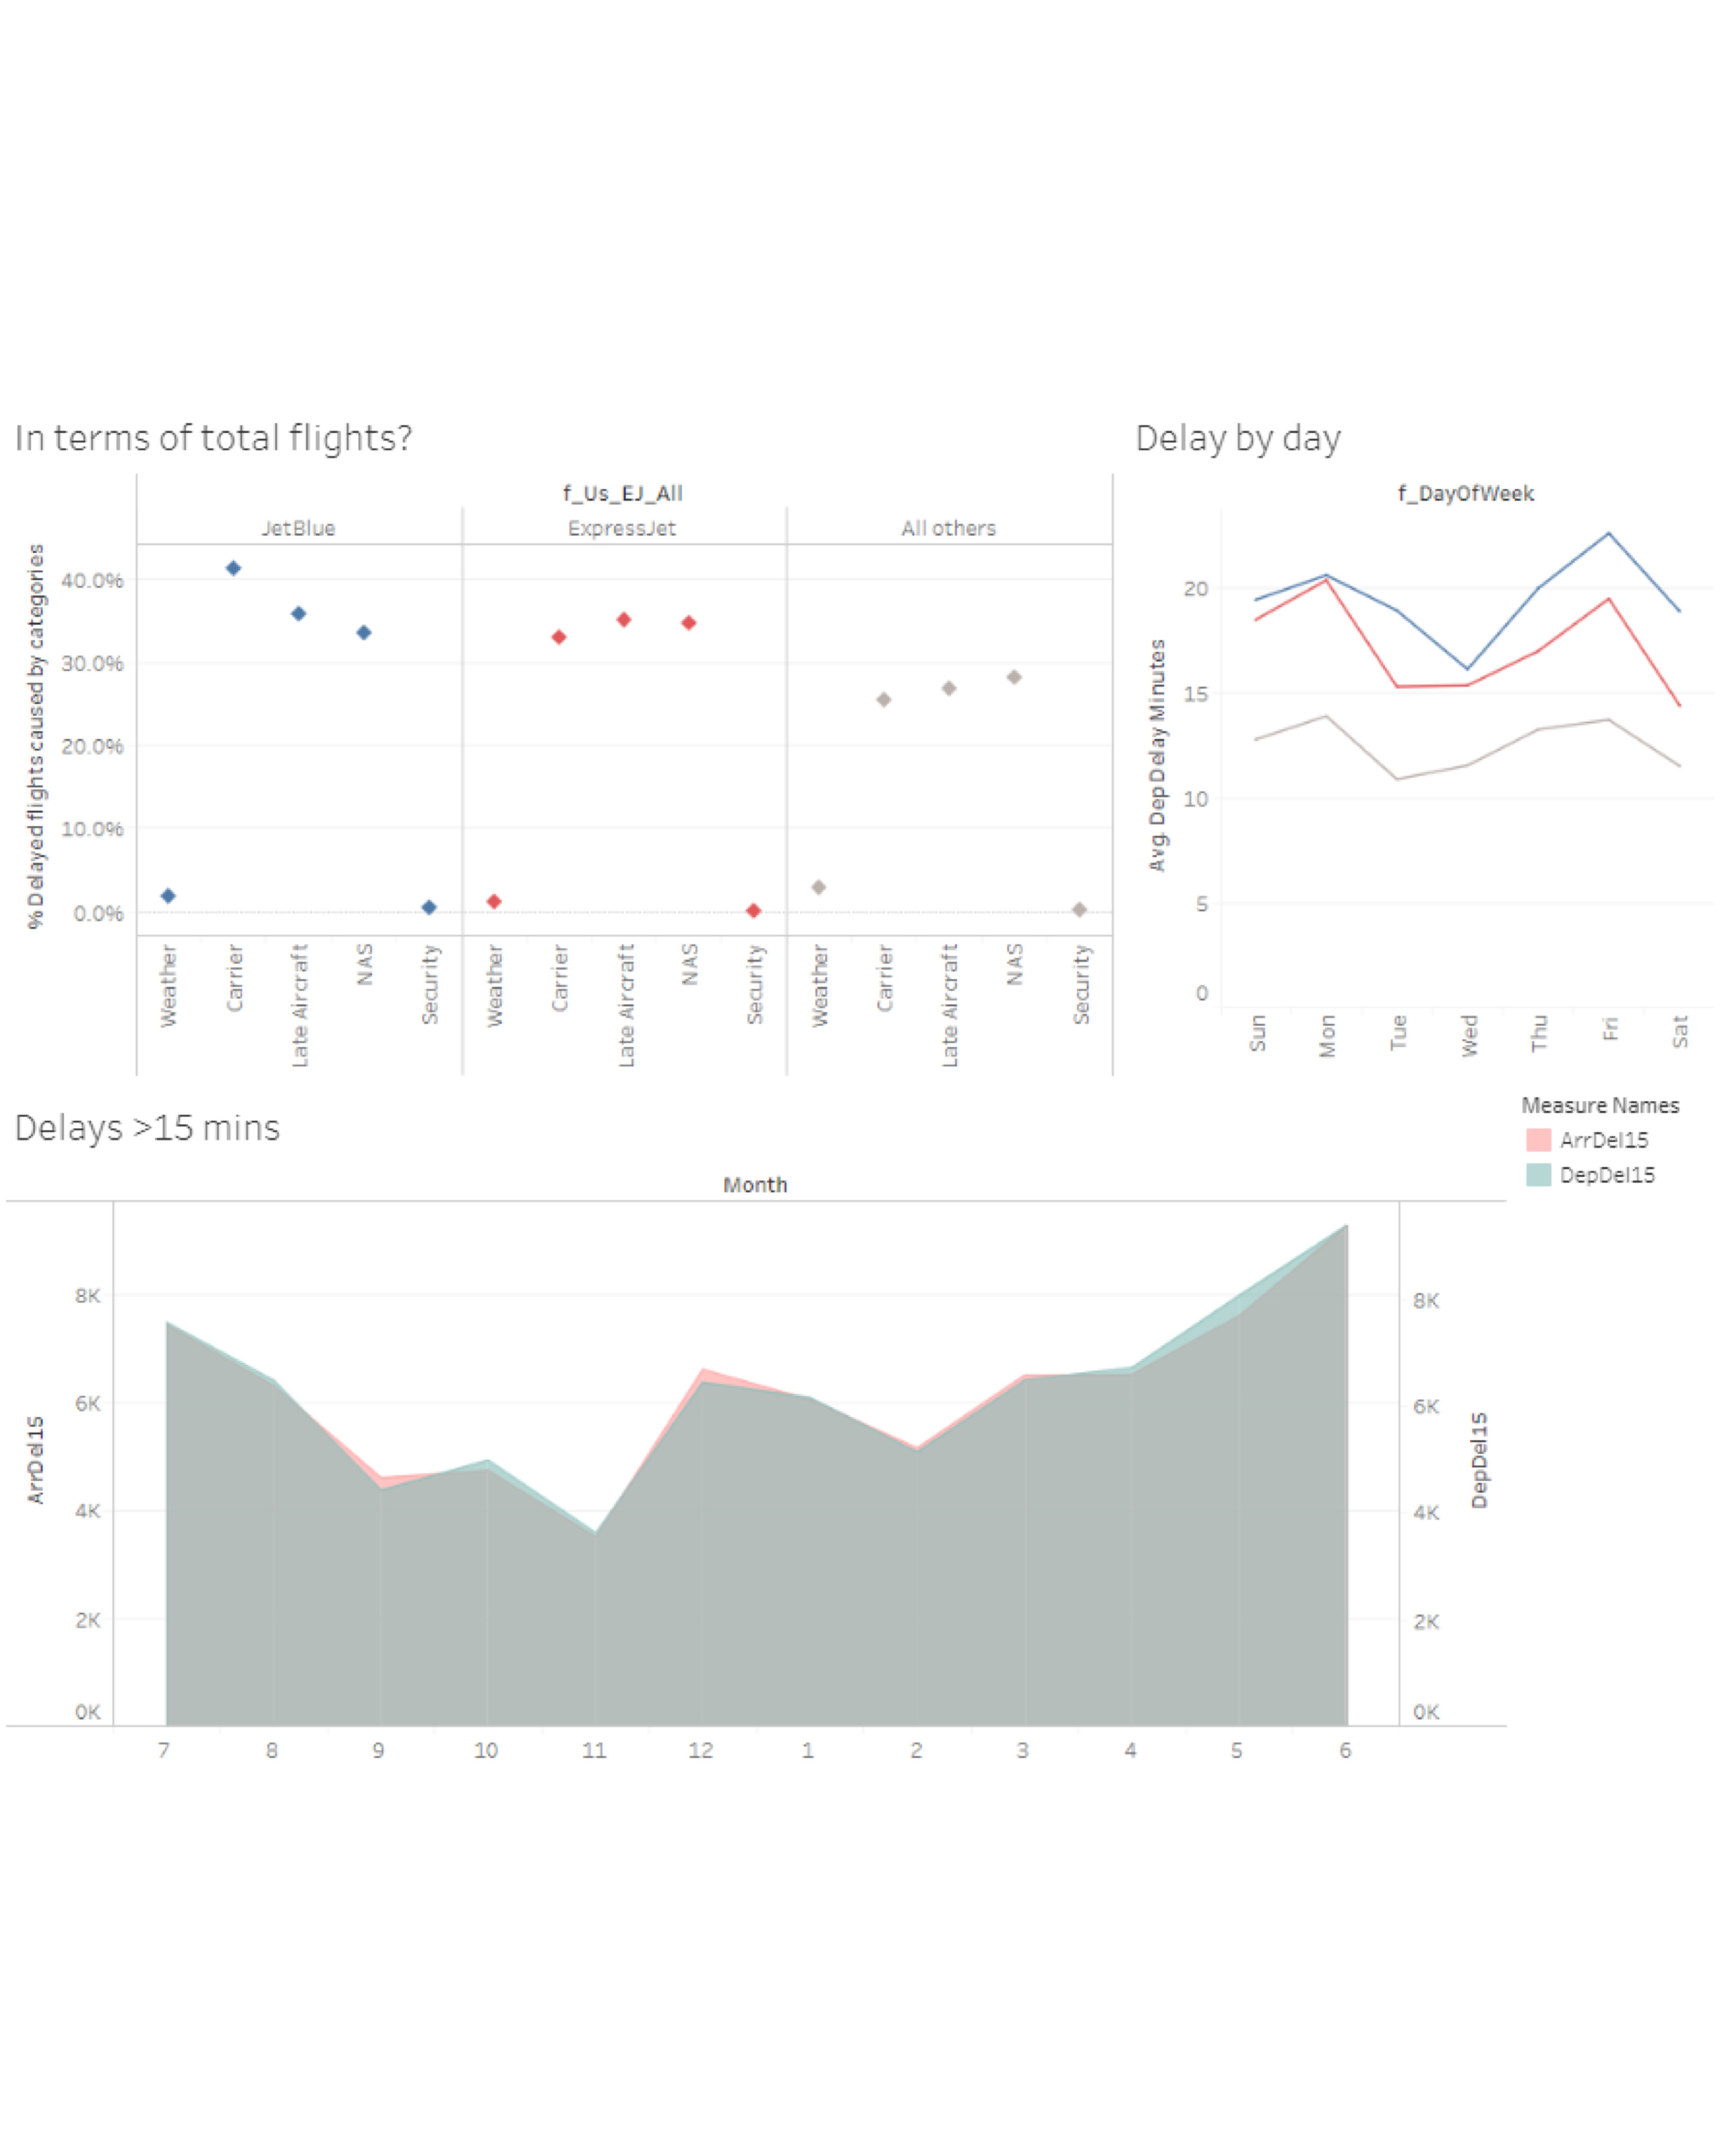
Performed KPI, competitor analysis of JetBlue's on-time performances and delays and Identified 2 key competitors, 6 major airports & 23 major routes for increasing traffic & improving customer engagement. Developed a comprehensive executive storyboard to provide actionable insights and opportunities for growth.

Improved the user experience of finding the different programs offered by Universities by building a recommender system and integrating it with a WordPress website which leveraged IBM Watson's Conversation & Discovery Services to provide recommendations based on user’s preference and profile.
The chatbot also responds to frequently asked applicant’s admission queries.
Data of different programs has been extracted from UIC Web pages and integrated into the Chatbot using IBM Watson Discovery Services.
Built the startup business canvas model which elaborated the unique value proposition, cost structure, revenue streams, customer segments, channels and key activities
This IBOT could potentially reduce #calls by 30%, email inquiries by 40% and reduce overall response time by 20% and save $140K/year for Universities.

Analyzed BTS monthly flight on-time performance file for June 2015 to estimate an OLS Regression Model and a LOGISTIC regression model for each carrier.
Code:View code
Estimated an Ordinal Logit Model and a Multinomial logistic regression model using March 2015 BTS file. Estimated an OLS regression model using O'Hare 2015 weather file. Finally invoked R from SAS to run the same model to compare results of both.
Code:View code
Estimated a Poisson regression model using may 2015 BTS file. Estimated a penalized regression model using the LASSO method using the same data.
Code:View code

Retrieved data from Github wordcount Project into Google Big Table for the purposes of research and business intelligence.
Conducted thorough analysis on Google Big Table as a tool for storing data.
Implemented storing, Map/Reduce, clustering, sharding, and replication of wordcount data.
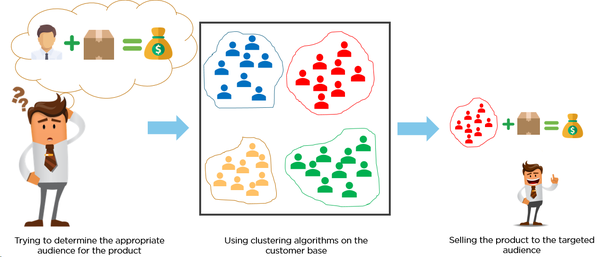
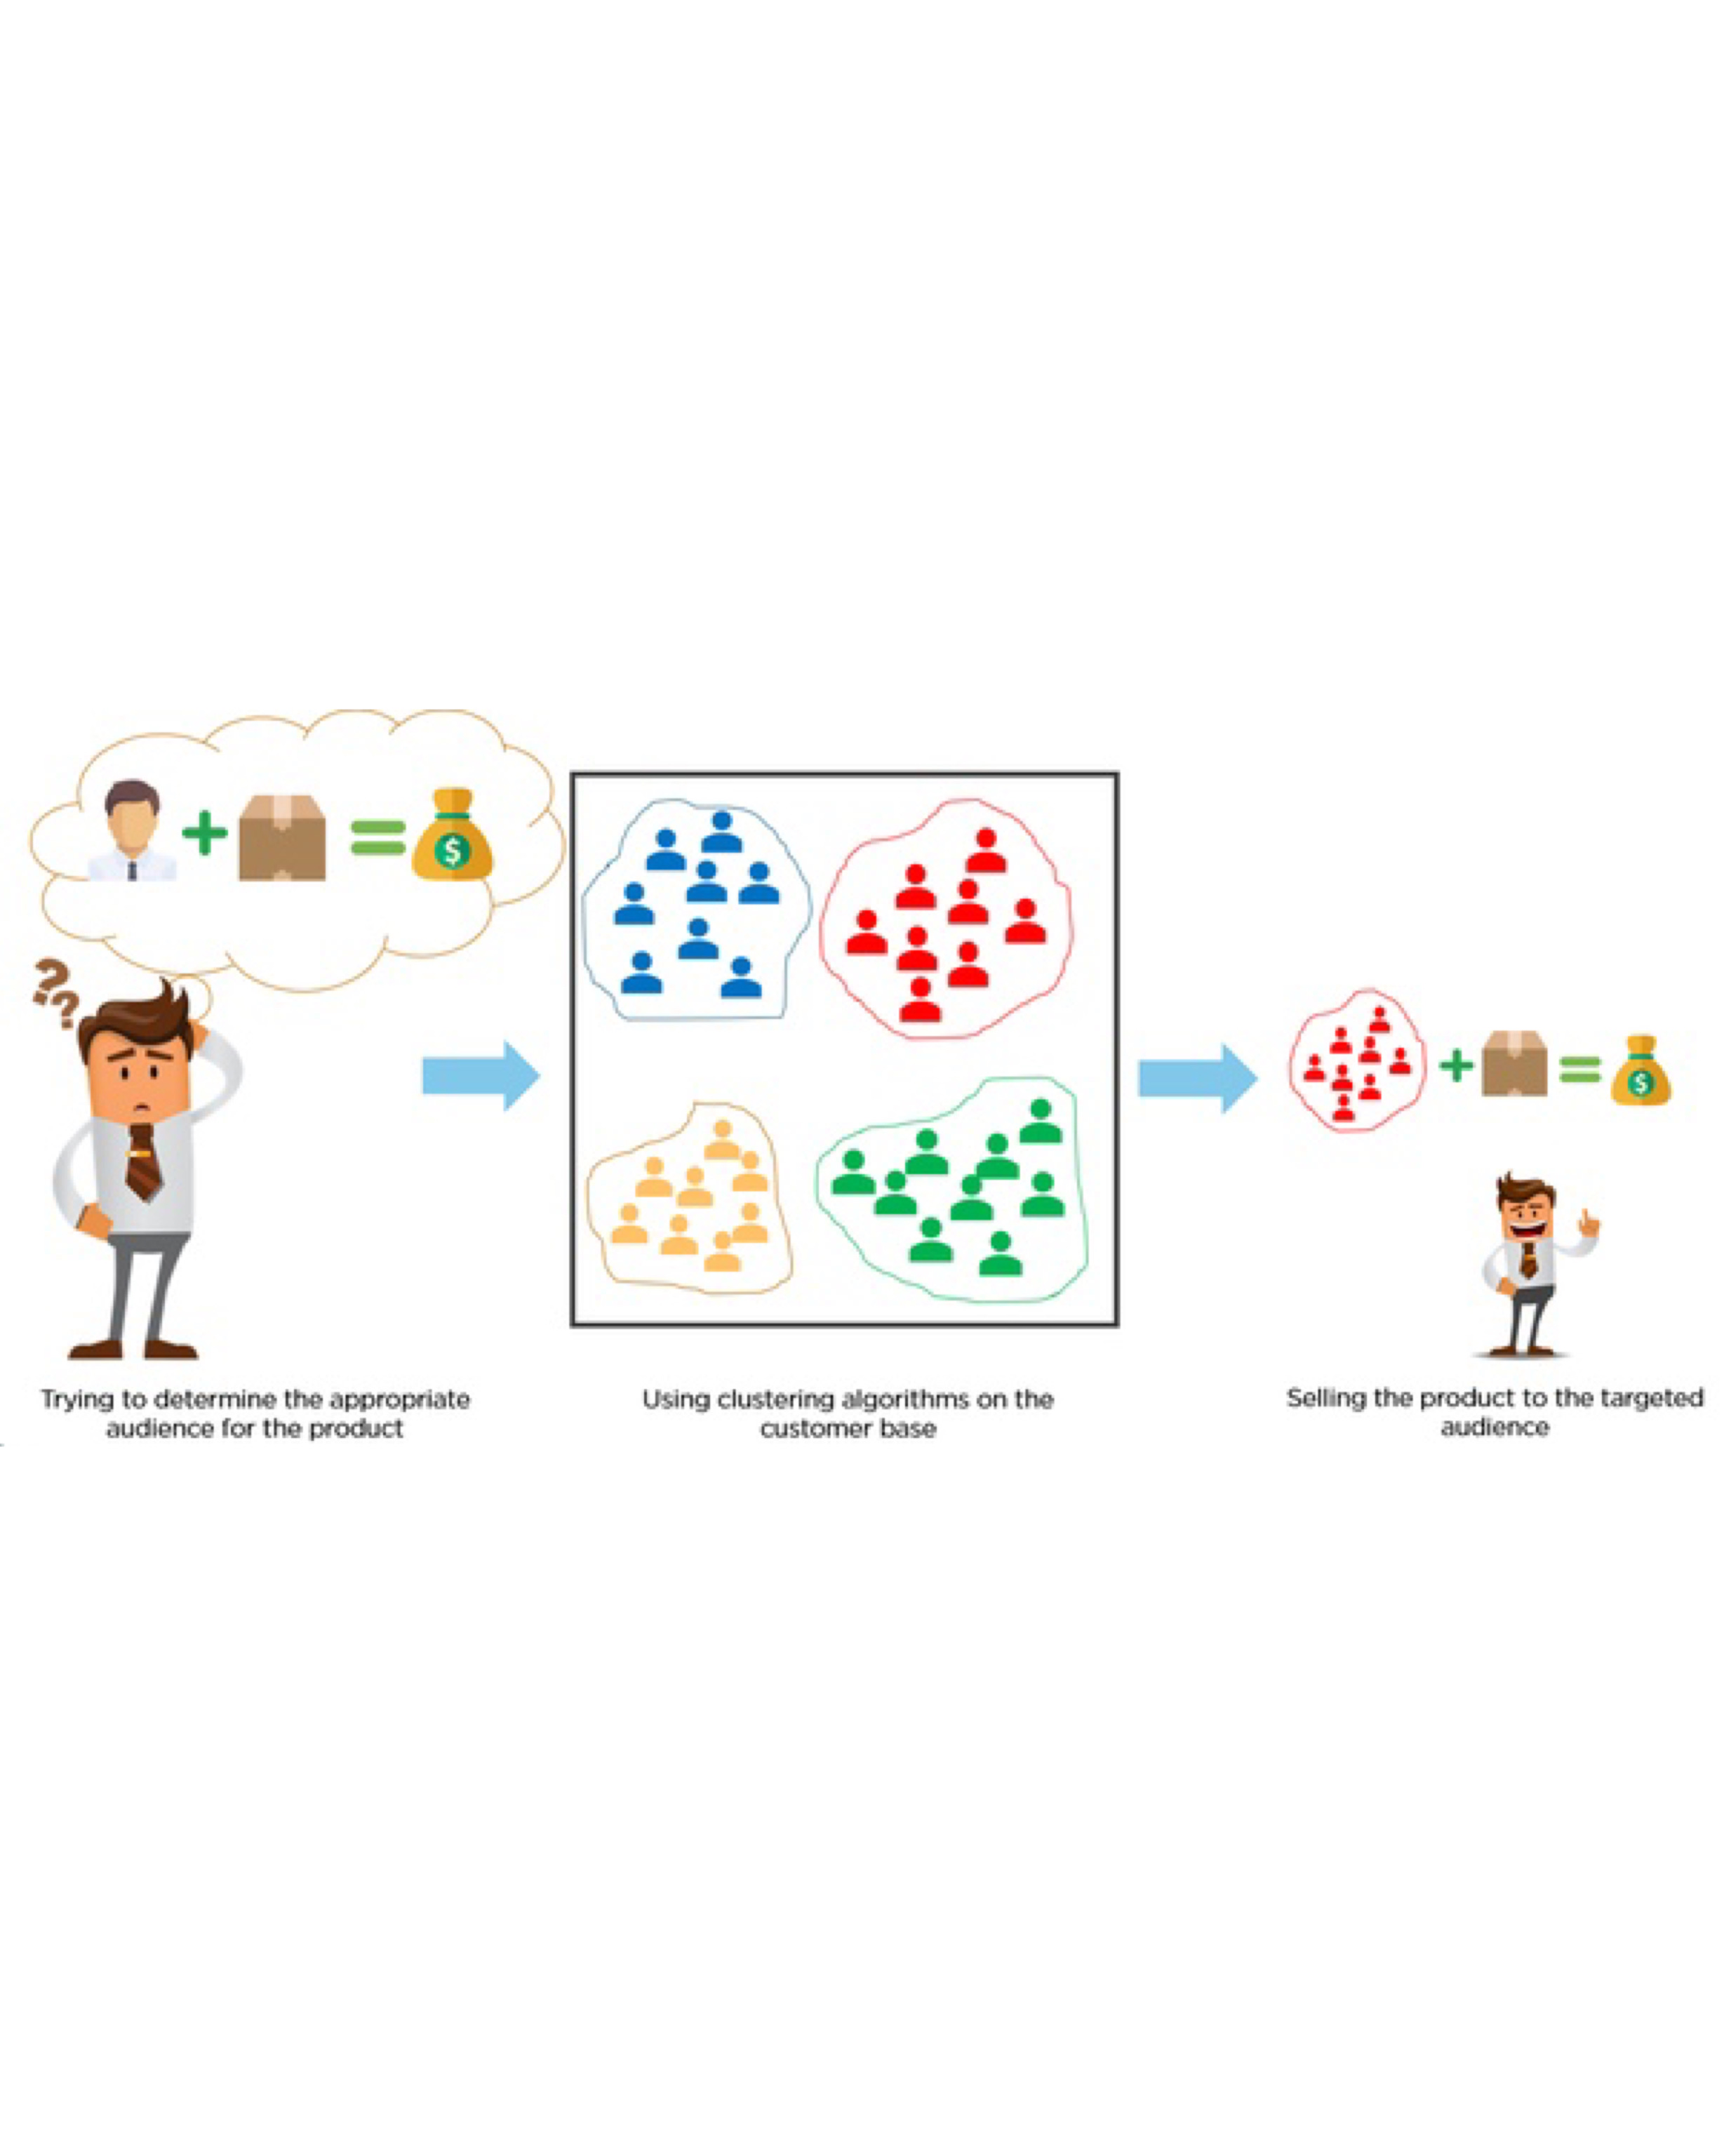
Performed EDA of CRISA bath soap data containing 600 observations and 46 attributes. Segmented customers based on their purchase behavior and brand loyalty.
Leveraged insights from the demographics & transaction data & developed a 5-cluster K-means model. Provided recommendations to guide advertisement & promotional campaigns.
Analyzed and performed EDA of 2016’s Airbnb Melbourne data which were merged with 3rd party data containing 25 features and 7280 observations
Conducted hypotheses testing and developed a multiple linear regression model to identify 2 key factors that affect the prices of these listings and determined the pricing pattern for different city zones